All articles
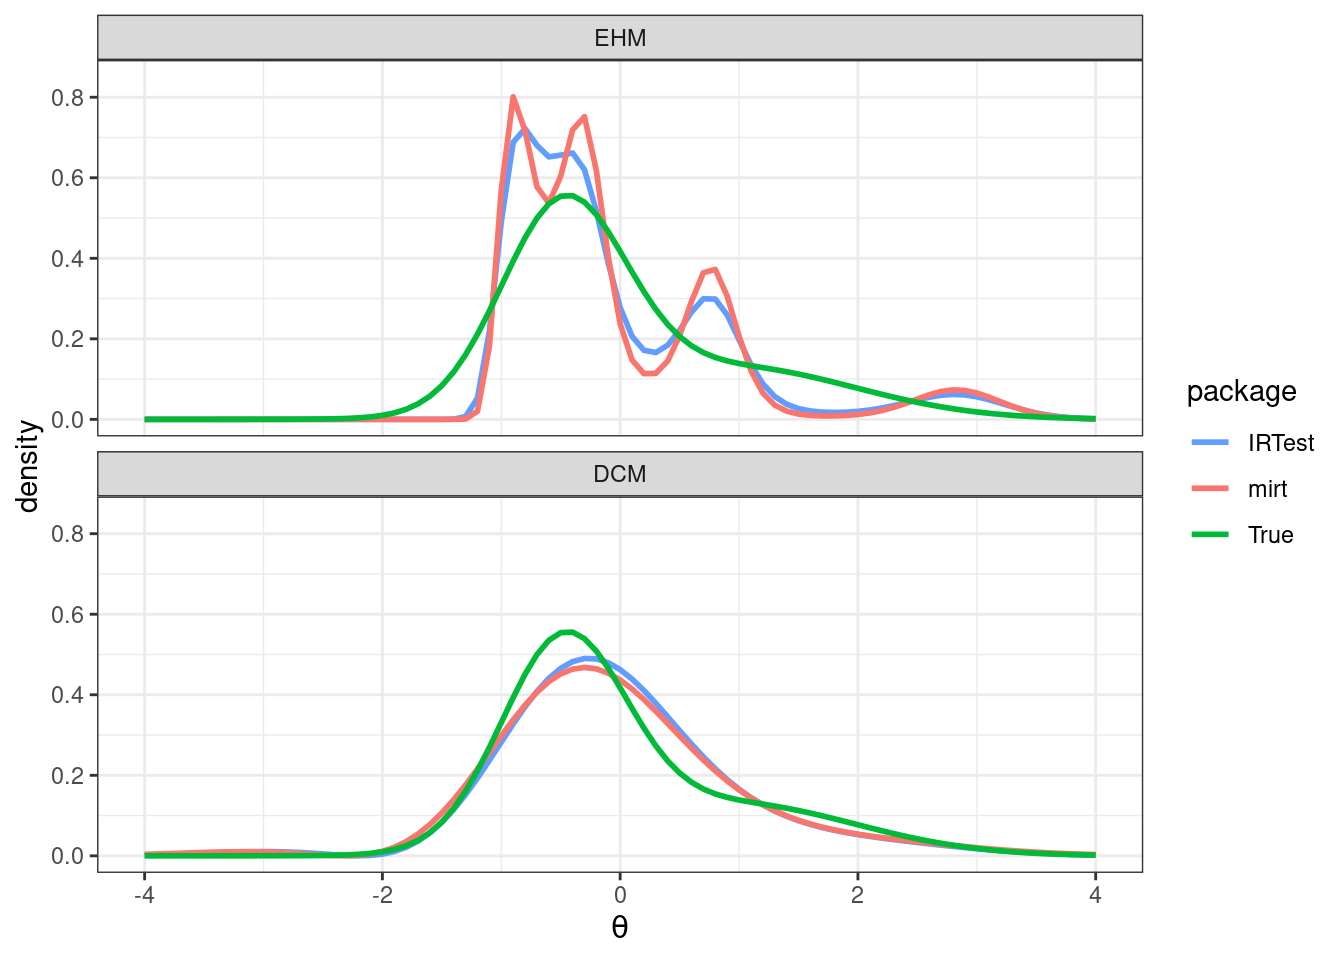
IRTest: An R Package for Item Response Theory with Estimation of Latent Distribution
Item response theory (IRT) models the relationship between respondents' latent traits and their responses to specific items. One key aspect of IRT is the assumption about the distribution of the latent variables, which can influence parameter estimation accuracy. While a normal distribution has been conventionally assumed, this may not always be appropriate. When the assumption of normality is violated, latent distribution estimation (LDE) can enhance parameter estimation accuracy by accommodating non-normal characteristics. Despite there being several methods proposed for LDE in IRT, there is a lack of software designed to handle their implementations. This paper introduces IRTest, a software program developed for IRT analysis that incorporates LDE procedures. It outlines the statistical foundation of LDE, details the functionalities of IRTest, and provides examples of IRT analyses to demonstrate the software's applications.
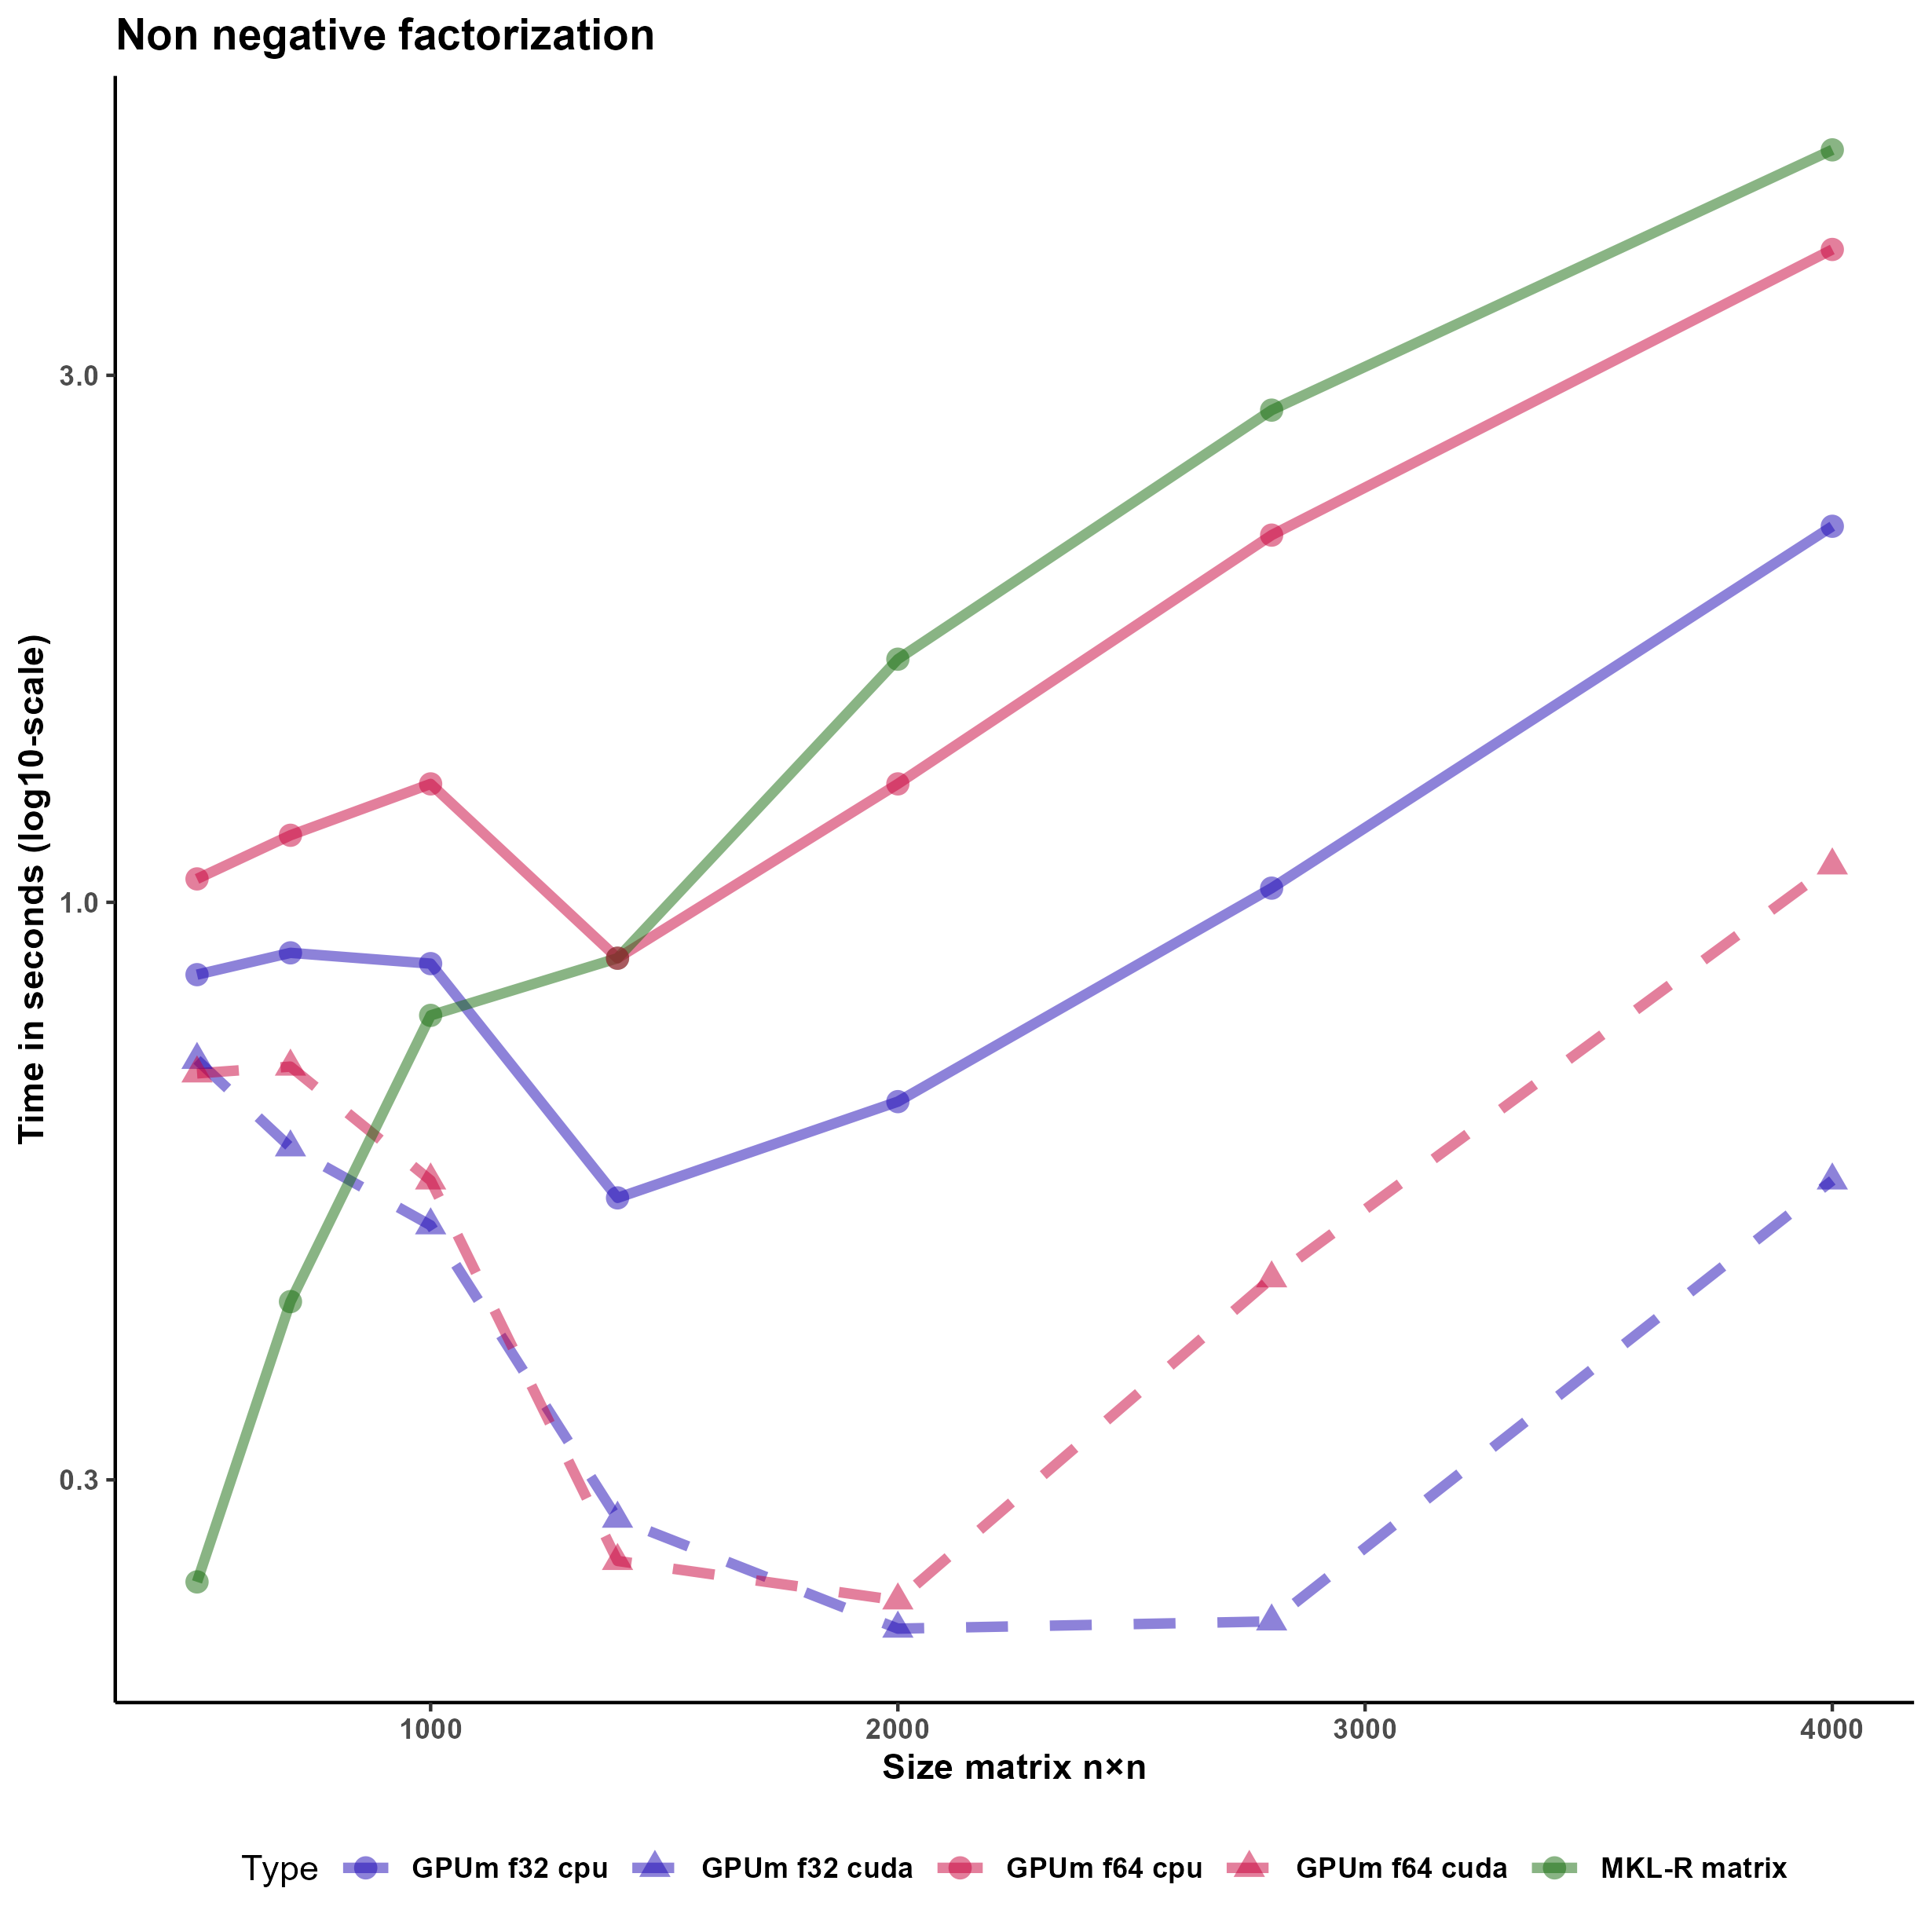
GPUmatrix: Seamlessly harness the power of GPU computing in R
GPUs are invaluable for data analysis, particularly in statistics and linear algebra, but integrating them with R has been challenging due to the lack of transparent, easily maintainable packages that don't require significant code alterations. Recognizing this gap, we've developed the GPUmatrix package, now available on CRAN, which emulates the Matrix package's behavior, enabling R to harness the power of GPUs for computations with minimal code adjustments. GPUmatrix supports both single (FP32) and double (FP64) precision data types and includes support for sparse matrices, ensuring broad applicability. Designed for ease of use, it requires only slight modifications to existing code, leveraging the Torch or Tensorflow R packages for GPU operations. We've validated its effectiveness in various statistical and machine learning tasks, including non-negative matrix factorization, logistic regression, and general linear models, and provided a comparative analysis of GPU versus CPU performance, highlighting significant efficiency gains.
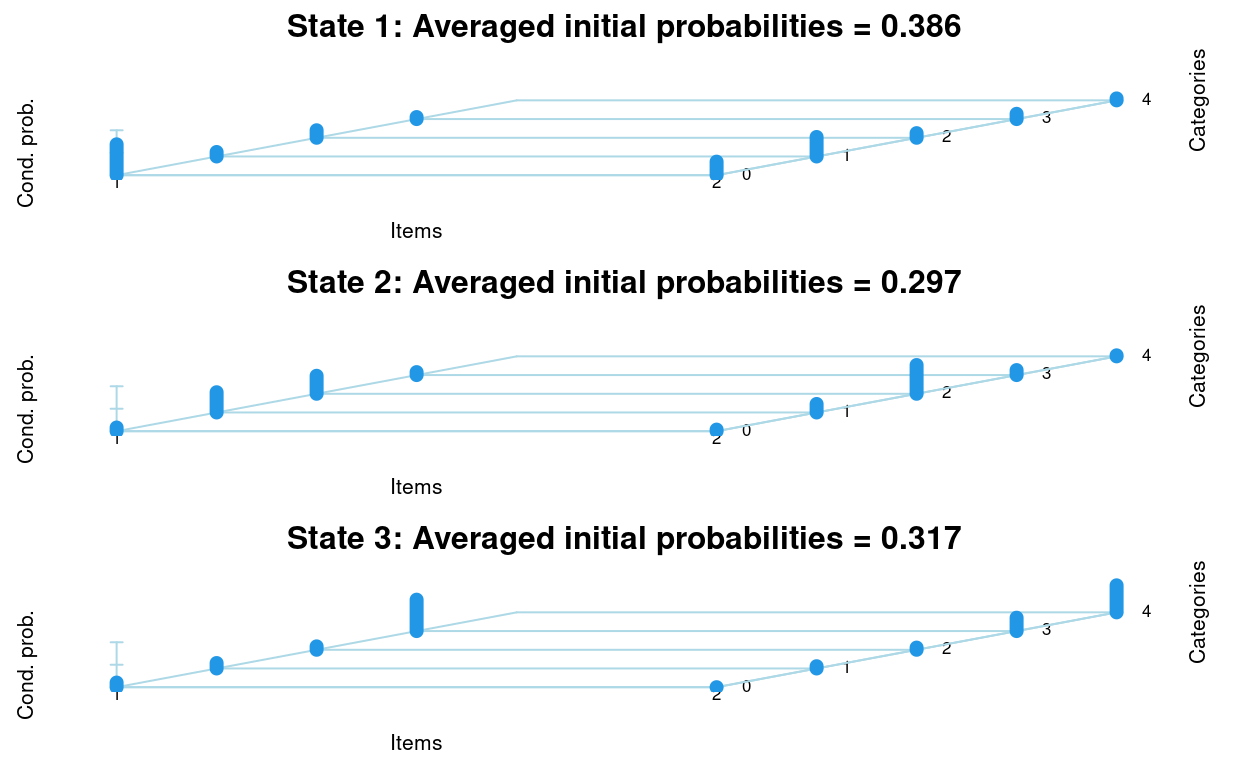
LMest: An R Package for Estimating Generalized Latent Markov Models
We provide a detailed overview of the updated version of the R package LMest, which offers functionalities for estimating Markov chain and latent or hidden Markov models for time series and longitudinal data. This overview includes a description of the modeling structure, maximum-likelihood estimation based on the Expectation-Maximization algorithm, and related issues. Practical applications of these models are illustrated using real and simulated data with both categorical and continuous responses. The latter are handled under the assumption of the Gaussian distribution given the latent process. When describing the main functions of the package, we refer to potential applicative contexts across various fields. The LMest package introduces several key novelties compared to previous versions. It now handles missing responses under the missing-at-random assumption and provides imputed values. The implemented functions allow users to display and visualize model results. Additionally, the package includes functions to perform parametric bootstrap for inferential procedures and to simulate data with complex structures in longitudinal contexts.
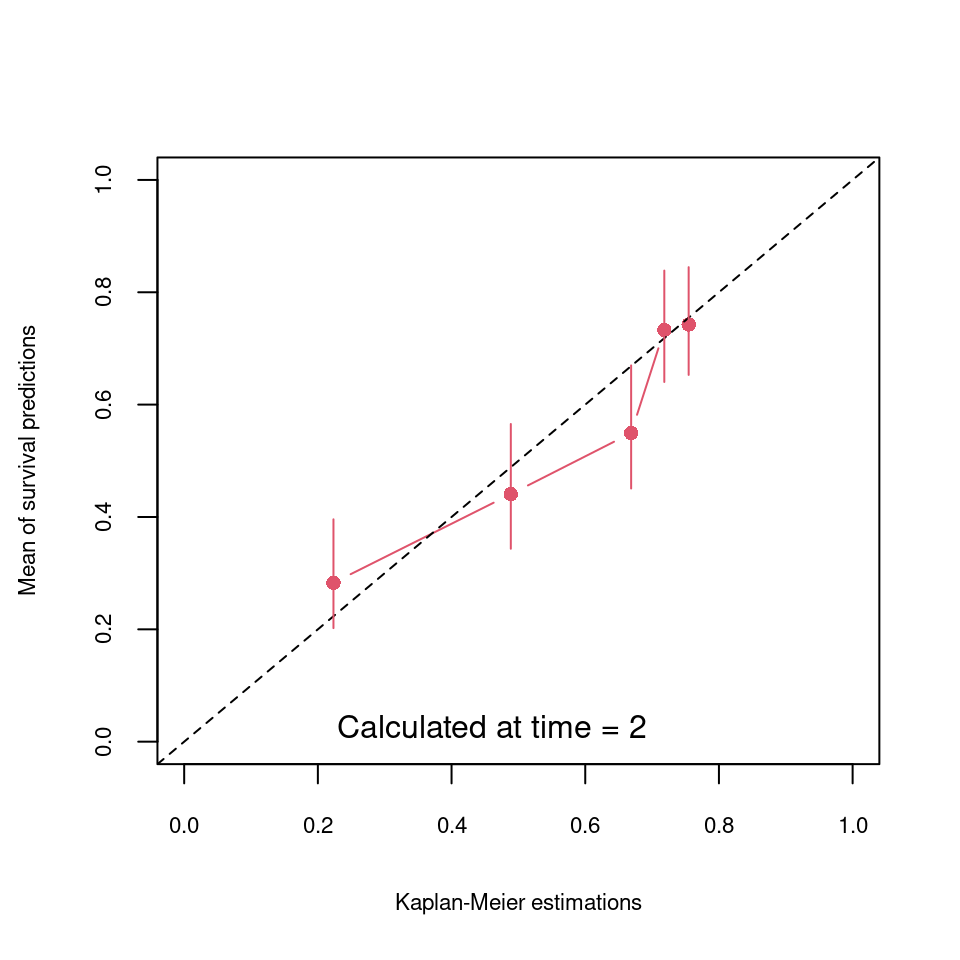
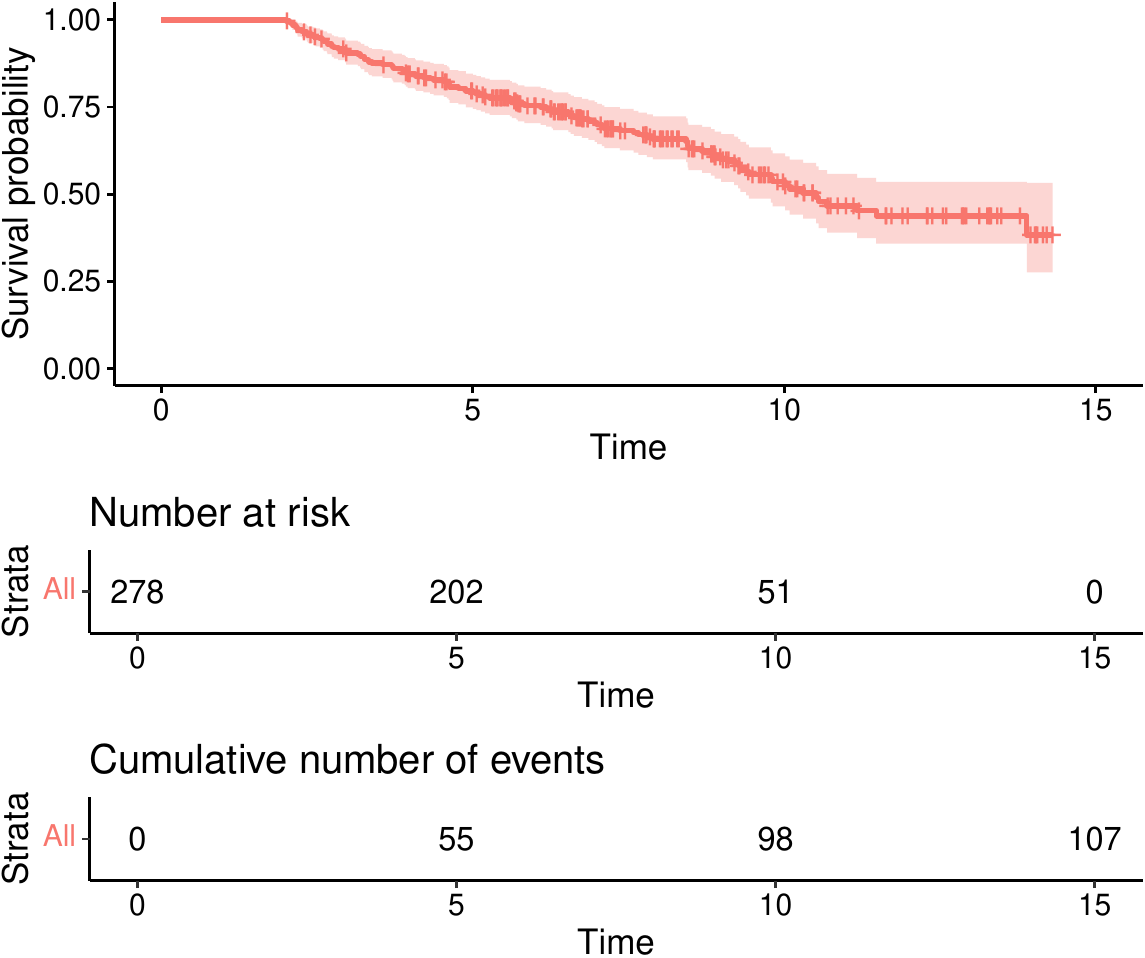
survivalSL: an R Package for Predicting Survival by a Super Learner
The R package \pkg{survivalSL} contains a variety of functions to construct a super learner in the presence of censored times-to-event and to evaluate its prognostic capacities. Compared to the available packages, we propose additional learners, loss functions for the parameter estimations, and user-friendly functions for evaluating prognostic capacities and predicting survival curves from new observations. We performed simulations to describe the value of our proposal. We also detailed its usage by an application in multiple sclerosis. Because machine learning is increasingly being used in predictive studies with right-censoring, we believe that our solution can be useful for a large community of data analysts, beyond this clinical application .
Splinets -- Orthogonal Splines for Functional Data Analysis
This study introduces an efficient workflow for functional data analysis in classification problems, utilizing advanced orthogonal spline bases. The methodology is based on the flexible Splinets package, featuring a novel spline representation designed for enhanced data efficiency. The focus here is to show that the novel features make the package a powerful and efficient tool for advanced functional data analysis. Two main aspects of spline implemented in the package are behind this effectiveness: 1) Utilization of Orthonormal Spline Bases -- the workflow incorporates orthonormal spline bases, known as splinets, ensuring a robust foundation for data representation; 2) Consideration of Spline Support Sets -- the implemented spline object representation accounts for spline support sets, which refines the accuracy of sparse data representation. Particularly noteworthy are the improvements achieved in scenarios where data sparsity and dimension reduction are critical factors. The computational engine of the package is the dyadic orthonormalization of B-splines that leads the so-called splinets -- the efficient orthonormal basis of splines spanned over arbitrarily distributed knots. Importantly, the locality of $B$-splines concerning support sets is preserved in the corresponding splinet. This allows for the mathematical elegance of the data representation in an orthogonal basis. However, if one wishes to traditionally use the $B$-splines it is equally easy and efficient because all the computational burden is then carried in the background by the splinets. Using the locality of the orthogonal splinet, along with implemented algorithms, the functional data classification workflow is presented in a case study in which the classic Fashion MINST dataset is used. Significant efficiency gains obtained by utilization of the package are highlighted including functional data representation through stable and efficient computations of the functional principal components. Several examples based on classical functional data sets, such as the wine data set, showing the convenience and elegance of working with Splinets are included as well.

Calculating Standardised Indices Using SEI
Standardised indices are measurements of variables on a standardised scale. The standardised scale facilitates comparisons between different variables, and its probabilistic interpretation means the indices are effective for risk management and decision making. Standardised indices have become popular in weather and climate settings, for example within operational drought monitoring systems, and have also been applied in other contexts, such as to energy variables. To facilitate their implementation in practice, the SEI package in R allows the flexible calculation of standardised indices. This paper discusses the theory underlying well-known standardised indices, outlines the general framework to construct them, and provides implementation details for the SEI package. Two case studies are presented whereby standardised indices are applied to climate and energy variables.
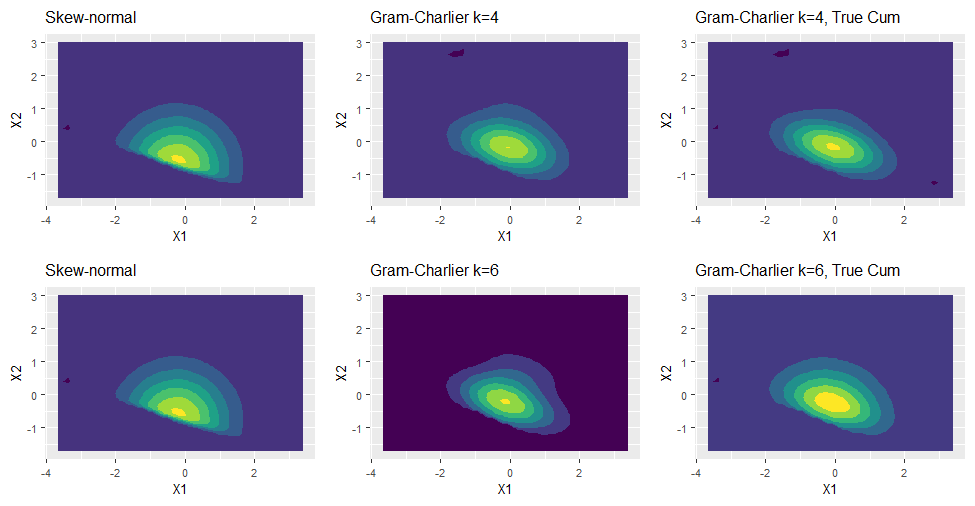
MultiStatM: Multivariate Statistical Methods in R
The package MultiStatM presents a vectorial approach to multivariate moments and cumulants. Functions provided concern algorithms to build set partitions and commutator matrices, multivariate d-Hermite polynomials; theoretical vector moments and vector cumulants of multivariate distributions and their conversion formulae. Applications discussed concern multivariate measures of skewness and kurtosis; asymptotic covariances for d-variate Hermite polynomials and multivariate moments and cumulants; Gram-Charlier approximations.
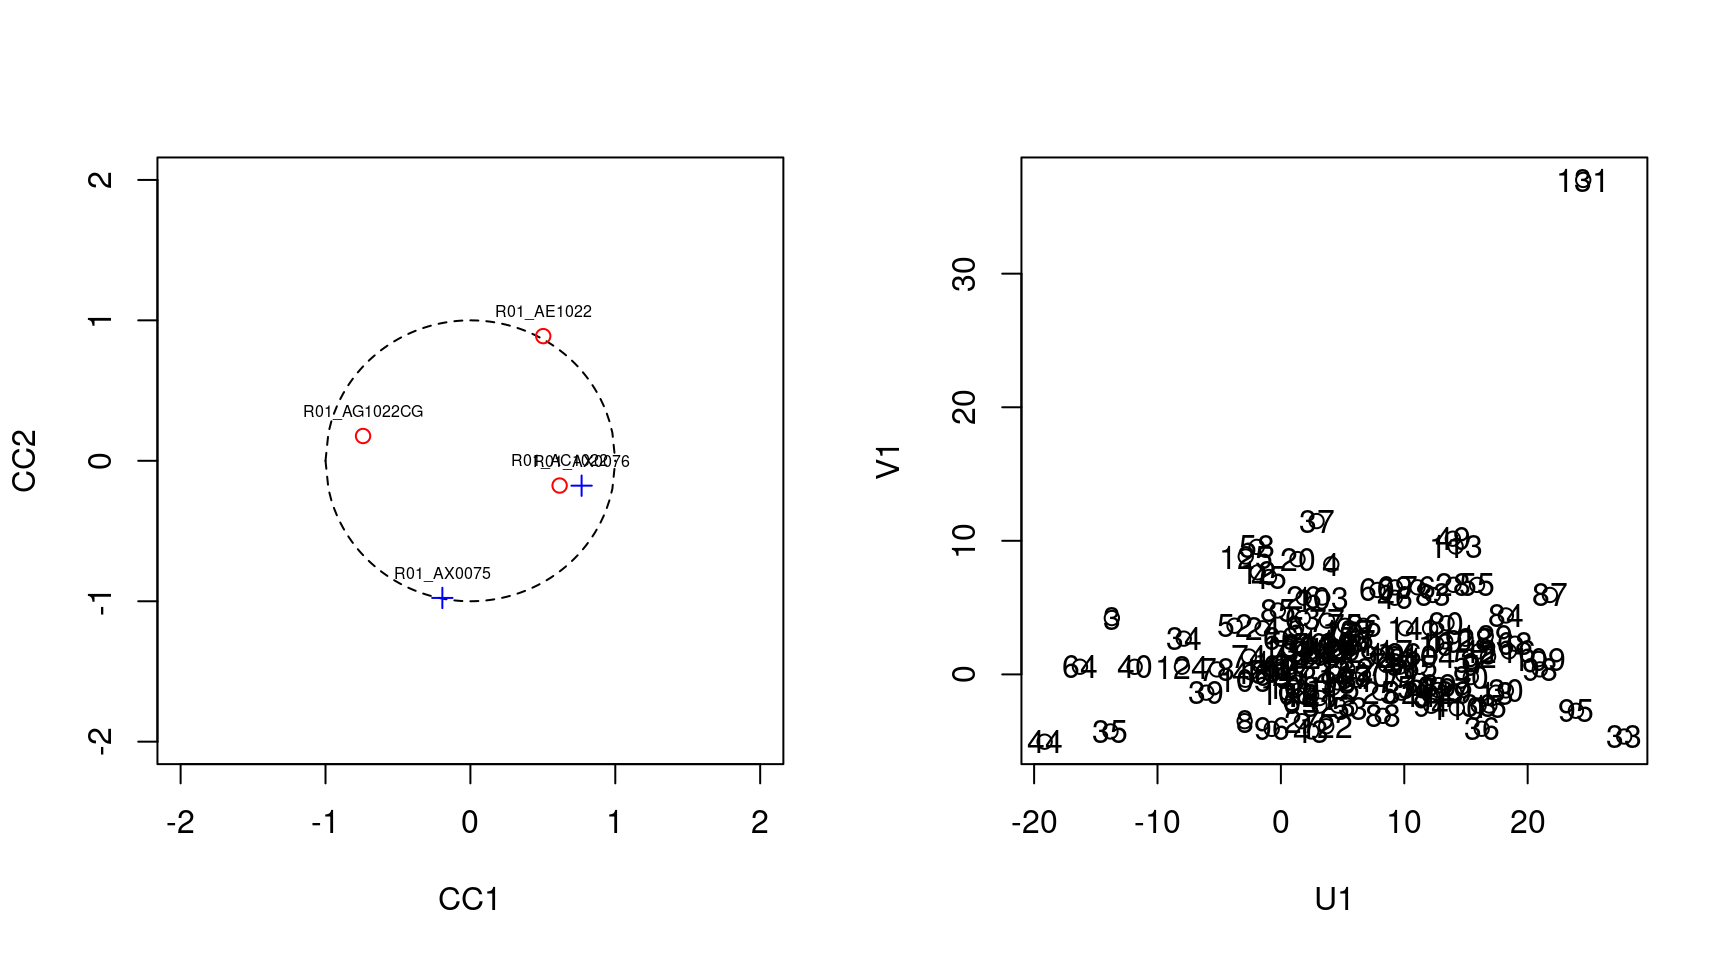
Canonical Correlation Analysis of Survey Data: The SurveyCC R Package
Classic Canonical Correlation Analysis (CCA) is a popular statistical method that allows for the analysis of the associations between two sets of variables. However, currently it cannot be applied following the published methodological documentation to data sets collected using complex survey design (CSD), which includes factors, such as replicate weights, clusters, and strata, that are critical for the accurate calculation of the statistical significance of any correlation. To close this gap, we have developed the Survey CC algorithm and implemented it in an R package. We describe the theoretical foundations of our algorithm and provide a detailed report of the options of the function that performs it. Moreover, the application of our newly developed method to several national survey data sets shows the differences in conclusions that can be reached if the CSD elements are not taken into consideration during the calculation of the statistical significance of the canonical correlations.

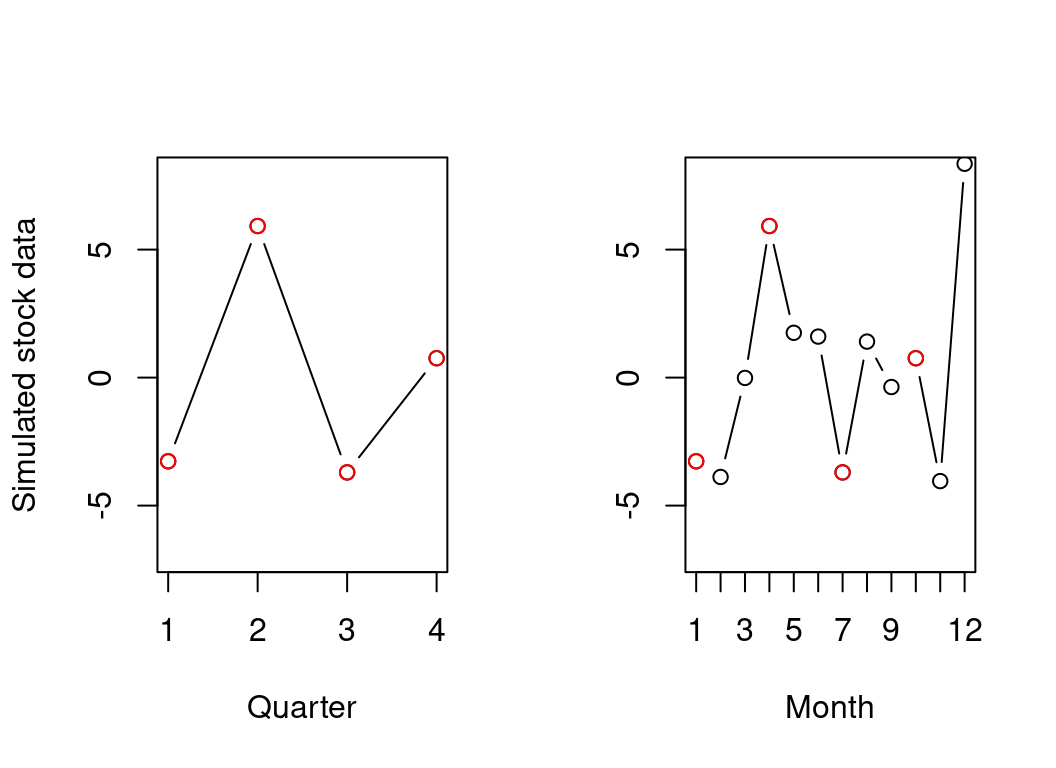
UpAndDownPlots: An R Package for Displaying Absolute and Percentage Changes
UpAndDown plots display the ups and downs of sector changes that make up an overall change between two time points. They show percentage changes by height and absolute changes by area. Most alternative displays only show percentage changes. UpAndDown plots can visualise changes in indices, in consumer markets, in stock markets, in elections, showing how the changes for sectors or for individual components contribute to the overall change. Examples in this paper include the UK's Consumer Price Index, Northern Ireland population estimates, and the German car market.
Disaggregating Time-Series with Many Indicators: An Overview of the DisaggregateTS Package
Low-frequency time-series (e.g., quarterly data) are often treated as benchmarks for interpolating to higher frequencies, since they generally exhibit greater precision and accuracy in contrast to their high-frequency counterparts (e.g., monthly data) reported by governmental bodies. An array of regression-based methods have been proposed in the literature which aim to estimate a target high-frequency series using higher frequency indicators. However, in the era of big data and with the prevalence of large volumes of administrative data-sources there is a need to extend traditional methods to work in high-dimensional settings, i.e., where the number of indicators is similar or larger than the number of low-frequency samples. The package DisaggregateTS includes both classical regressions-based disaggregation methods alongside recent extensions to high-dimensional settings. This paper provides guidance on how to implement these methods via the package in R, and demonstrates their use in an application to disaggregating CO2 emissions.
Validating and Extracting Information from National Identification Numbers in R: The Case of Finland and Sweden
National identification numbers (NIN) and similar identification code systems are widely used for uniquely identifying individuals and organizations in Finland, Sweden, and many other countries. To increase the general understanding of such techniques of identification, openly available methods and tools for NIN analysis and validation are needed. The hetu and sweidnumbr R packages provide functions for extracting embedded information, checking the validity, and generating random but valid numbers in the context of Finnish and Swedish NINs and other identification codes. In this article, we demonstrate these functions from both packages and provide theoretical context and motivation on the importance of the subject matter. Our work contributes to the growing toolkit of standardized methods for computational social science research, epidemiology, demographic studies, and other register-based inquiries.
fmeffects: An R Package for Forward Marginal Effects
Forward marginal effects have recently been introduced as a versatile and effective model-agnostic interpretation method particularly suited for non-linear and non-parametric prediction models. They provide comprehensible model explanations of the form: if we change feature values by a pre-specified step size, what is the change in the predicted outcome? We present the R package fmeffects, the first software implementation of the theory surrounding forward marginal effects. The relevant theoretical background, package functionality and handling, as well as the software design and options for future extensions are discussed in this paper.
GSSTDA: Implementation in an R Package of the Progression of Disease with Survival Analysis (PAD-S) that Integrates Information on Genes Linked to Survival in the Mapper Filter Function
GSSTDA is a new package for R that implements a new analysis for trascriptomic data, the Progression Analysis of Disease with Survival (PAD-S) by Fores-Martos et al. (2022), which allows to identify groups of samples differentiated by both survival and idiosyncratic biological features. Although it was designed for transcriptomic analysis, it can be used with other types of continuous omics data. The package implements the main algorithms associated with this methodology, which first removes the part of expression that is considered physiological using the Disease-Specific Genomic Analysis (DSGA) and then analyzes it using an unsupervised classification scheme based on Topological Data Analysis (TDA), the Mapper algorithm. The implementation includes code to perform the different steps of this analysis: data preprocessing by DSGA, the selection of genes for further analysis and a new filter function, which integrates information about genes related to survival, and the Mapper algorithm for generating a topological invariant Reeb graph. These functions can be used independently, although a function that performs the entire analysis is provided. This paper describes the methodology and implementation of these functions, and reports numerical results using an extract of real data base application.
Kernel Heaping - Kernel Density Estimation from regional aggregates via measurement error model
The phenomenon of "aggregation" often occurs in the regional dissemination of information via choropleth maps. Choropleth maps represent areas or regions that have been subdivided and color-coded proportionally to ordinal or scaled quantitative data. By construction discontinuities at the boundaries of rigid aggregation areas, often of administrative origin, occur and inadequate choices of reference areas can lead to errors, misinterpretations and difficulties in the identification of local clusters. However, these representations do not reflect the reality. Therefore, a smooth representation of georeferenced data is a common goal. The use of naive non-parametric kernel density estimators based on aggregates positioned at the centroids of the areas result also in an inadequate representation of reality. Therefore, an iterative method based on the Simulated Expectation Maximization algorithm was implemented in the Kernelheaping package. The proposed approach is based on a partly Bayesian algorithm treating the true unknown geocoordinates as additional parameters and results in a corrected kernel density estimate.
GeoAdjust: Adjusting for Positional Uncertainty in Geostatistial Analysis of DHS Data
The R-package GeoAdjust adjusts for positional uncertainty in GPS coordinates and performs fast empirical Bayesian geostatistical inference for household survey data from the Demographic and Health Surveys (DHS) Program. DHS household survey data is important for tracking demographic and health indicators, but is published with intentional positional error to preserve the privacy of the household respondents. Such jittering has recently been shown to deteriorate geostatistical inference and prediction, and GeoAdjust is the first software package that corrects for jittering in geostatistical models containing both spatial random effects and raster- and distance-based covariates. The package provides inference for model parameters and predictions at unobserved locations, and supports Gaussian, binomial and Poisson likelihoods with identity link, logit link, and log link functions, respectively. GeoAdjust provides functions that make model and prior specification intuitive and flexible for the user, as well as routines for plotting and output analysis.
SIHR: Statistical Inference in High-Dimensional Linear and Logistic Regression Models
We introduce the R package SIHR for statistical inference in high-dimensional generalized linear models with continuous and binary outcomes. The package provides functionalities for constructing confidence intervals and performing hypothesis tests for low-dimensional objectives in both one-sample and two-sample regression settings. We illustrate the usage of SIHR through simulated examples and present real data applications to demonstrate the package's performance and practicality.
SNSeg: An R Package for Time Series Segmentation via Self-Normalization
T
SLCARE: An R Package for Semiparametric Latent Class Analysis of Recurrent Events
Recurrent event data frequently arise in biomedical follow-up studies. The concept of latent classes enables researchers to characterize complex population heterogeneity in a plausible and parsimonious way. This article introduces the R package SLCARE, which implements a robust and flexible algorithm to carry out Zhao, Peng, and Hanfelt (2022)’s latent class analysis method for recurrent event data, where semiparametric multiplicative intensity modeling is adopted. SLCARE returns estimates for non-functional model parameters along with the associated variance estimates and $p$ values. Visualization tools are provided to depict the estimated functional model parameters and related functional quantities of interest. SLCARE also delivers a model checking plot to help assess the adequacy of the fitted model.

PubChemR: An R Package for Accessing Chemical Data from PubChem
Chemical data is a cornerstone in the fields of chemistry, pharmacology, bioinformatics, and environmental science. The PubChemR package provides a comprehensive R interface to the PubChem database, which is one of the largest and most complete repositories of chemical data. This package simplifies the process of querying and retrieving chemical information, including compound structures, properties, biological activities, and more, directly from within R. By leveraging PubChemR, users can programmatically access a wealth of chemical data, which is essential for research and analysis in the chemical sciences. The package supports various functionalities such as searching by chemical identifiers, downloading chemical structures, and retrieving bioassay results, among others. PubChemR is designed to be user-friendly, providing a intuitive experience for R users ranging from academic researchers to practitioners across various scientific disciplines. This paper presents the capabilities of PubChemR, demonstrates its use through practical examples, and discusses its potential impact on chemical data analysis.

boiwsa: An R Package for Seasonal Adjustment of Weekly Data
This article introduces the R package boiwsa for the seasonal adjustment of weekly data based on the discounted least squares method. It provides a user-friendly interface for computing seasonally adjusted estimates of weekly data and includes functions for creation of country-specific prior adjustment variables, as well as diagnostic tools to assess the quality of the adjustments. The utility of the package is demonstrated through two case studies: one based on US data of gasoline production characterized by a strong trend-cycle and dominant intra-yearly seasonality, and the other based on Israeli data of initial unemployment claims with two seasonal cycles (intra-yearly and intra-monthly) and the impact of two moving holidays.
LUCIDus: An R Package For Implementing Latent Unknown Clustering By Integrating Multi-omics Data (LUCID) With Phenotypic Traits
Many studies are leveraging current technologies to obtain multiple omics measurements on the same individuals. These measurements are usually cross-sectional, and methods developed and commonly used focus on omic integration at a single time point. More unique, and a growing area of interest, are studies that leverage biology or the temporal sequence of measurements to relate long-term exposures or germline genetics to intermediate measures capturing transitional processes that ultimately result in an outcome. In this context, we have previously introduced an integrative model named Latent Unknown Clustering by Integrating multi-omics Data (LUCID) aiming to distinguish unique effects of environmental exposures or germline genetics and informative omic effects while jointly estimating subgroups of individuals relevant to the outcome of interest. This multiple omics analysis consists of early integration (concatenation of omic layers to estimate common subgroups); intermediate integration (omic-layer-specific estimation of subgroups that are all related to the outcome); and late integration (omic-layer-specific estimation of subgroups that are then interrelated by a priori structures). In this article, we introduce LUCIDus version 3, an R package to implement the LUCID model. We review the statistical background of the model and introduce the workflow of LUCIDus, including model fitting, model selection, interpretation, inference, and prediction. Throughout, we use a realistic but simulated dataset based on an ongoing study, the Human Early Life Exposome Study (HELIX), to illustrate the workflow.
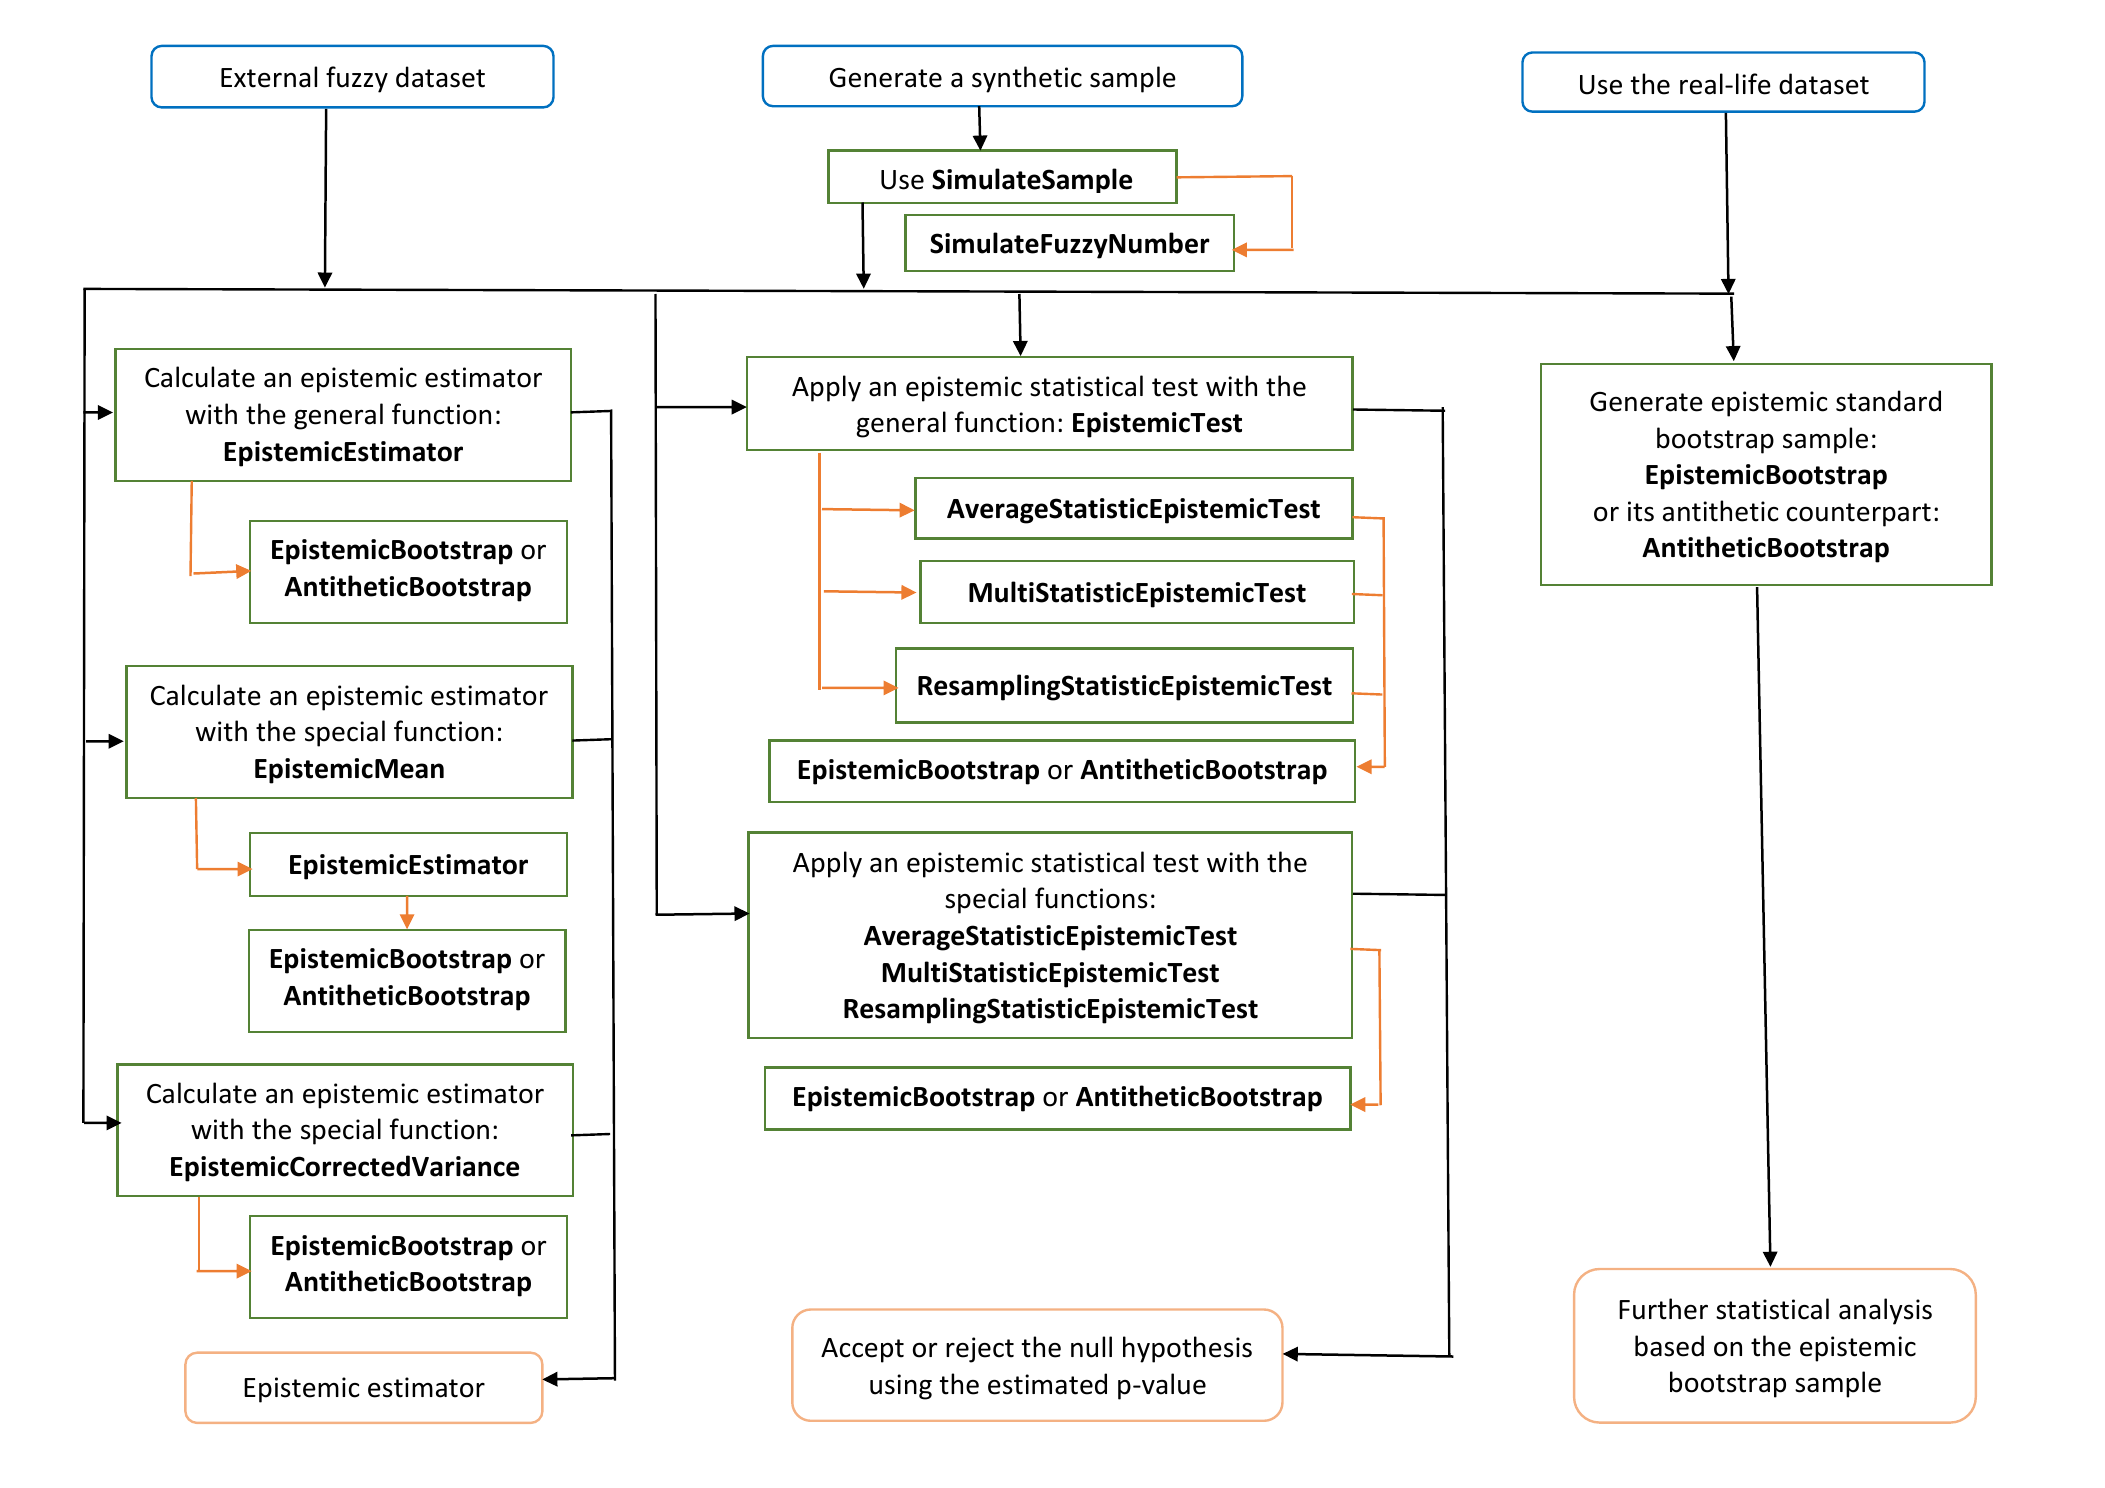
FuzzySimRes: Epistemic Bootstrap -- an Efficient Tool for Statistical Inference Based on Imprecise Data
The classical Efron's bootstrap is widely used in many areas of statistical inference, including imprecise data. In our new package FuzzySimRes, we adapted the bootstrap methodology to epistemic fuzzy data, i.e., fuzzy perceptions of the usual real-valued random variables. The epistemic bootstrap algorithms deliver real-valued samples generated randomly from the initial fuzzy sample. Then, these samples can be utilized directly in various statistical procedures. Moreover, we implemented a practically oriented simulation procedure to generate synthetic fuzzy samples and provided a real-life epistemic dataset ready to use for various techniques of statistical analysis. Some examples of their applications, together with the comparisons of the epistemic bootstrap algorithms and the respective benchmarks, are also discussed.
Rfssa: An R Package for Functional Singular Spectrum Analysis
Functional Singular Spectrum Analysis (FSSA) is a non-parametric approach for analyzing Functional Time Series (FTS) and Multivariate FTS (MFTS) data. This paper introduces Rfssa, an R package that addresses implementing FSSA for FTS and MFTS data types. Rfssa provides a flexible container, the funts class, for FTS/MFTS data observed on one-dimensional or multi-dimensional domains. It accepts arbitrary basis systems and offers powerful graphical tools for visualizing time-varying features and pattern changes. The package incorporates two forecasting algorithms for FTS data. Developed using object-oriented programming and Rcpp/RcppArmadillo, Rfssa ensures computational efficiency. The paper covers theoretical background, technical details, usage examples, and highlights potential applications of Rfssa.
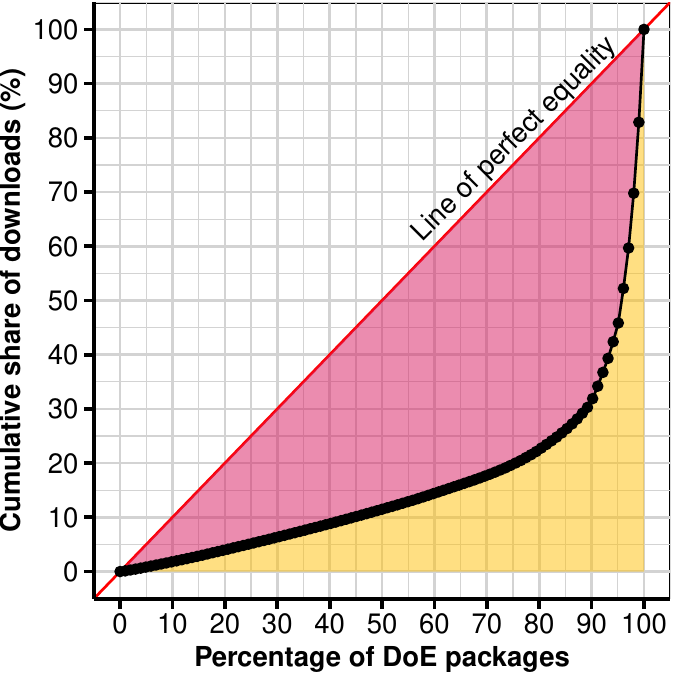
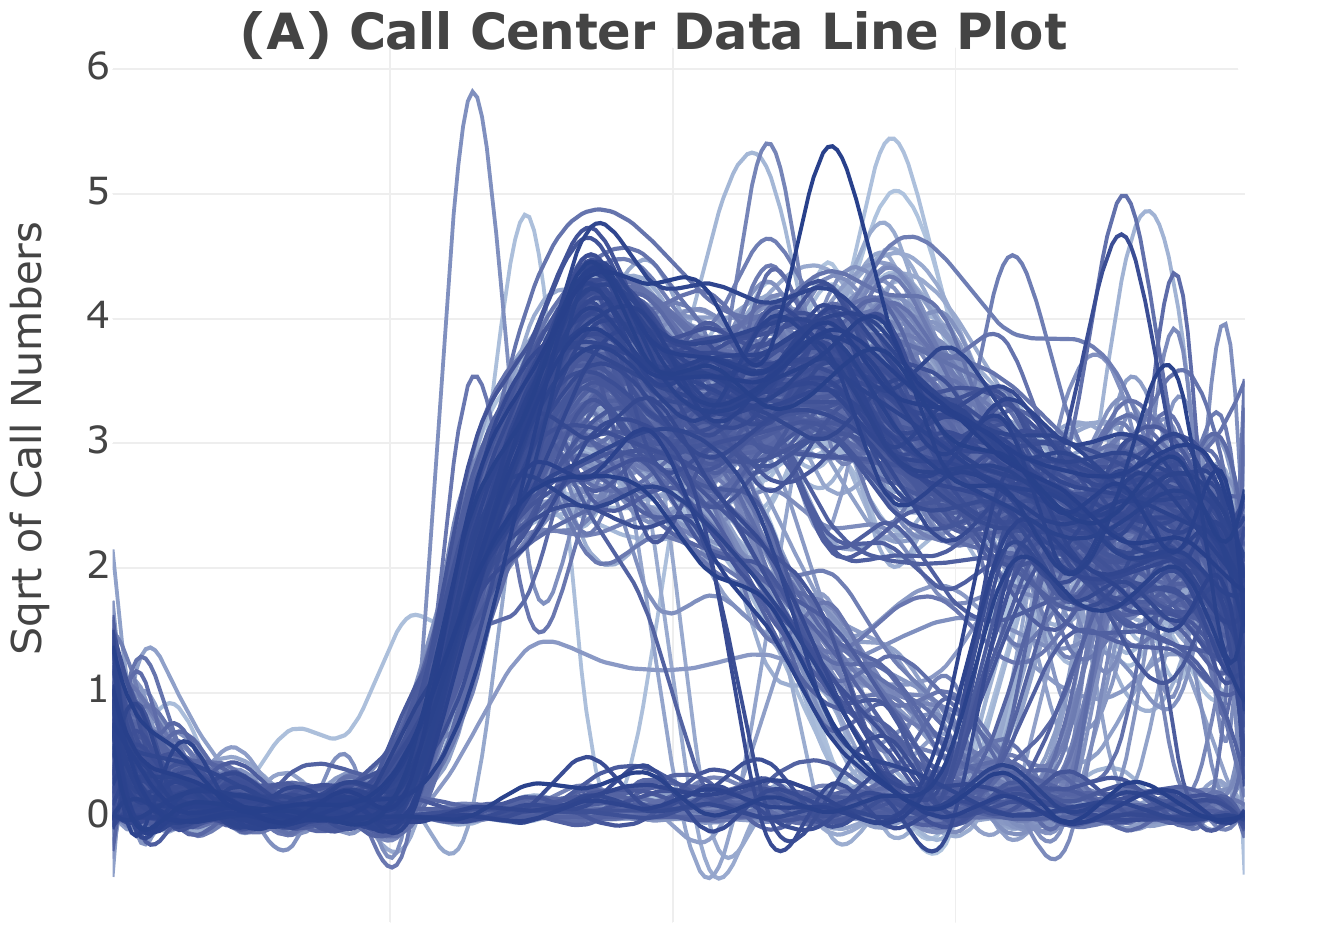
Current State and Prospects of R-Packages for the Design of Experiments
Re-running an experiment is generally costly and, in some cases, impossible due to limited resources; therefore, the design of an experiment plays a critical role in increasing the quality of experimental data. In this paper, we describe the current state of R-packages for the design of experiments through an exploratory data analysis of package downloads, package metadata, and a comparison of characteristics with other topics. We observed that experimental designs in practice appear to be sufficiently manufactured by a small number of packages, and the development of experimental designs often occurs in silos. We also discuss the interface designs of widely utilized R packages in the field of experimental design and discuss their future prospects for advancing the field in practice.
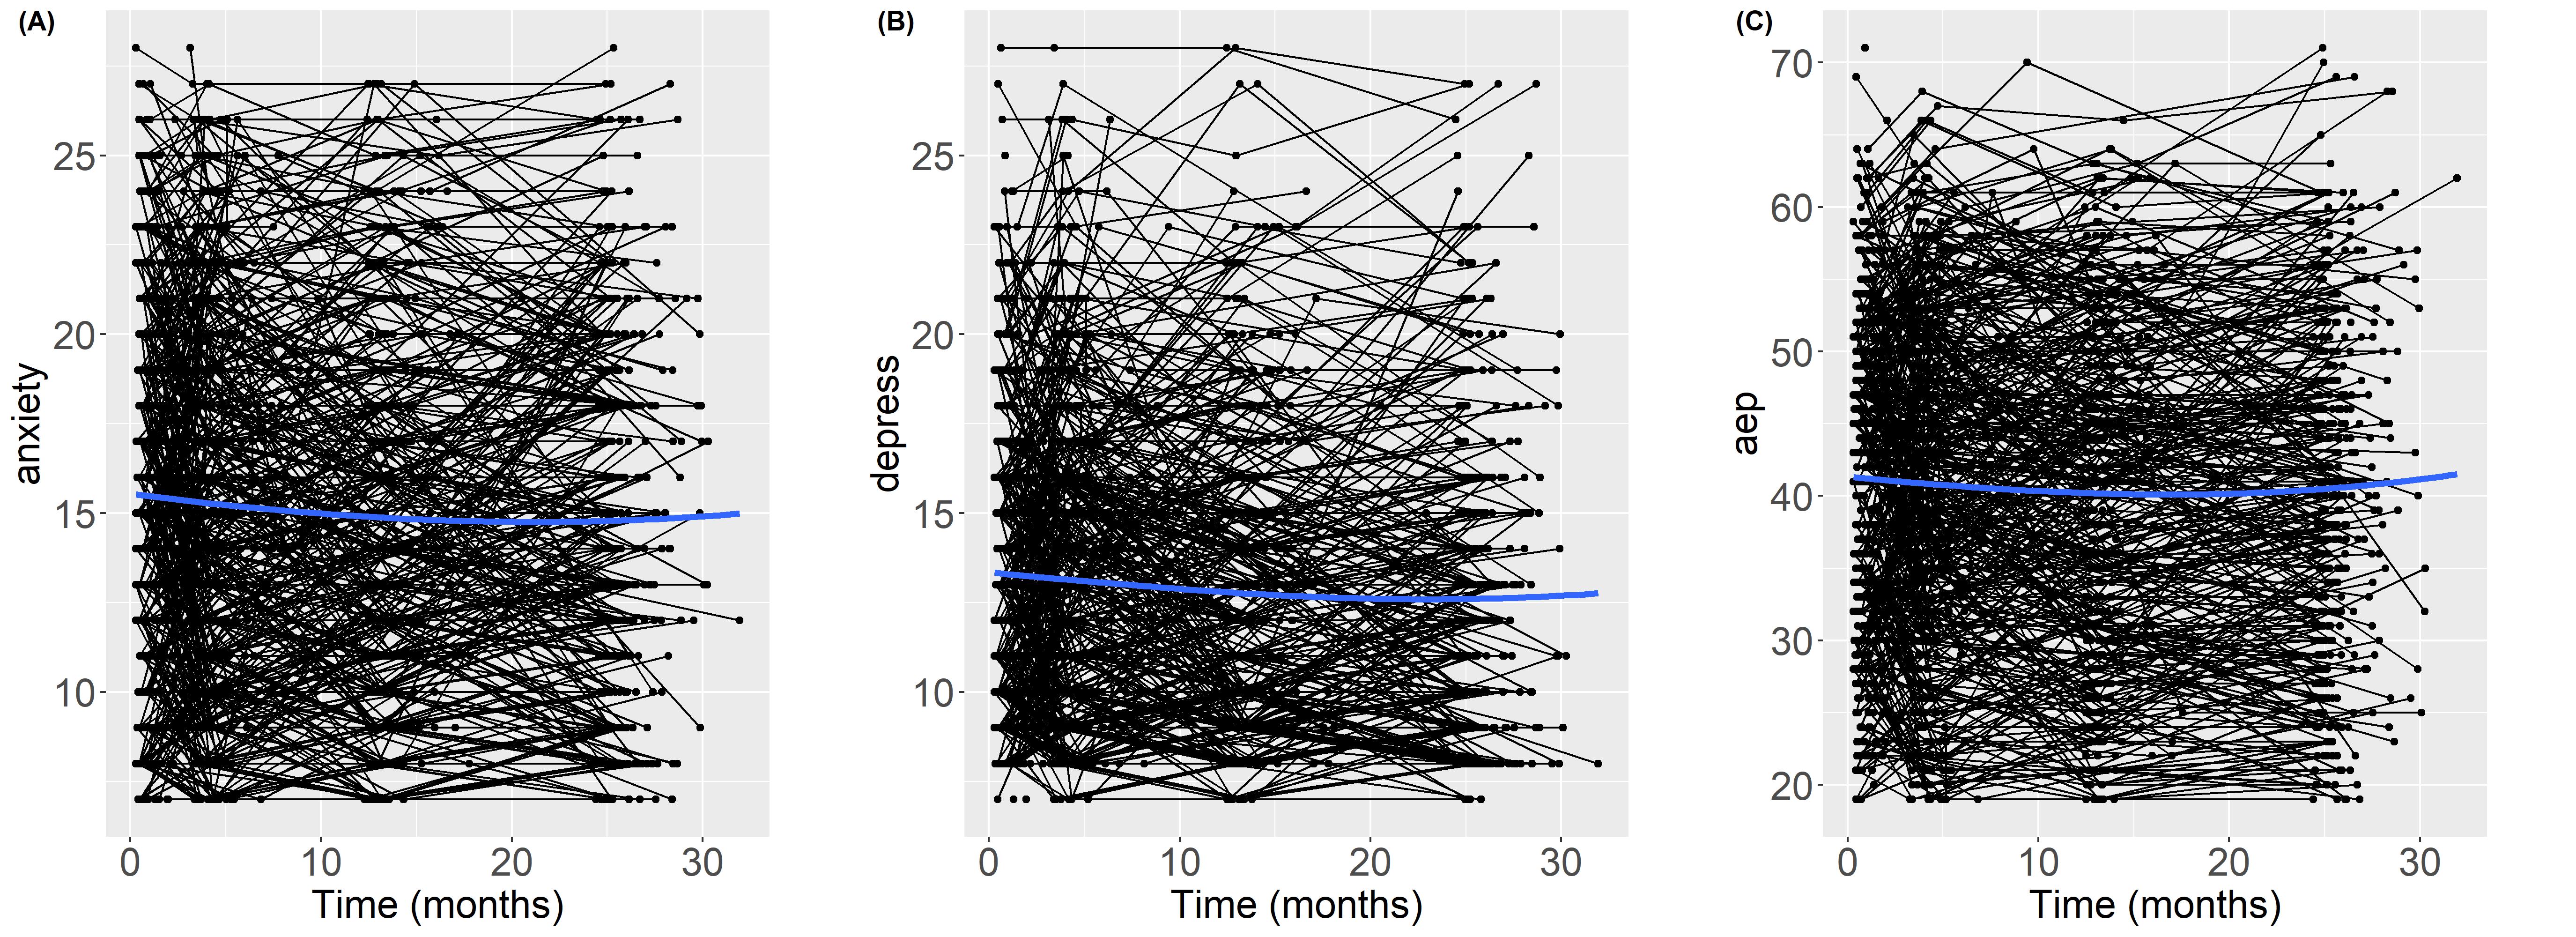
pencal: an R Package for the Dynamic Prediction of Survival with Many Longitudinal Predictors
In survival analysis, longitudinal information on the health status of a patient can be used to dynamically update the predicted probability that a patient will experience an event of interest. Traditional approaches to dynamic prediction such as joint models become computationally unfeasible with more than a handful of longitudinal covariates, warranting the development of methods that can handle a larger number of longitudinal covariates. We introduce the R package pencal, which implements a Penalized Regression Calibration (PRC) approach that makes it possible to handle many longitudinal covariates as predictors of survival. pencal uses mixed-effects models to summarize the trajectories of the longitudinal covariates up to a prespecified landmark time, and a penalized Cox model to predict survival based on both baseline covariates and summary measures of the longitudinal covariates. This article illustrates the structure of the R package, provides a step by step example showing how to estimate PRC, compute dynamic predictions of survival and validate performance, and shows how parallelization can be used to significantly reduce computing time.
clarify: Simulation-Based Inference for Regression Models
Simulation-based inference is an alternative to the delta method for computing the uncertainty around regression post-estimation (i.e., derived) quantities such as average marginal effects, average adjusted predictions, and other functions of model parameters. It works by drawing model parameters from their joint distribution and estimating quantities of interest from each set of simulated values, which form a simulated "posterior" distribution of the quantity from which confidence intervals can be computed. clarify provides a simple, unified interface for performing simulation-based inference for any user-specified derived quantities as well as wrappers for common quantities of interest. clarify supports a large and growing number of models through its interface with the marginaleffects package and provides native support for multiply imputed data.
BCClong: An R Package for Bayesian Consensus Clustering for Multiple Longitudinal Features
It is very common nowadays for a study to collect multiple longitudinal features and appropriately integrating these features simultaneously for defining individual subgroups (i.e., clusters) becomes increasingly crucial to understanding population heterogeneity and predicting future outcomes. The aim of this paper is to describe a new package, BCClong, which implements a Bayesian consensus clustering (BCC) model for multiple longitudinal features. Compared to existing packages, several key features make the BCClong package appealing: (a) it allows simultaneous clustering of mixed-type (e.g., continuous, discrete and categorical) longitudinal features, (b) it allows each longitudinal feature to be collected from different sources with measurements taken at distinct sets of time points (known as irregularly sampled longitudinal data), (c) it relaxes the assumption that all features have the same clustering structure by estimating the feature-specific (local) clusterings and consensus (global) clustering. Using two real data examples, we provide a tutorial with step-by-step instructions on using the package.
reslr: An R Package for Relative Sea Level Modelling
We present reslr, an R package to perform Bayesian modelling of relative sea level data. We include a variety of different statistical models previously proposed in the literature, with a unifying framework for loading data, fitting models, and summarising the results. Relative sea-level data often contain measurement error in multiple dimensions, and so our package allows for these to be included in the statistical models. When plotting the output sea level curves, the focus is often on comparing rates of change, and so our package allows for computation of the derivatives of sea level curves with appropriate consideration of the uncertainty. We provide a large example dataset from the Atlantic coast of North America and show some of the results that might be obtained from our package.
mcmsupply: An R Package for Estimating Contraceptive Method Market Supply Shares
In this paper, we introduce the R package mcmsupply which implements Bayesian hierarchical models for estimating and projecting modern contraceptive market supply shares over time. The package implements four model types. These models vary by the administration level of their outcome estimates (national or subnational estimates) and dataset type utilised in the estimation (multi-country or single-country contraceptive market supply datasets). The mcmsupply package contains a compilation of national and subnational level contraceptive source datasets, generated by Integrated Public Use Microdata Series (IPUMS) and Demographic and Health Survey (DHS) microdata. We describe the functions that implement the models through practical examples. The annual estimates and projections with uncertainty of the contraceptive market supply, produced by mcmsupply at a national and subnational level, are the first of their kind. These estimates and projections have diverse applications, including acting as an indicator of family planning market stability over time and being utilised in the calculation of estimates of modern contraceptive use.
Pomdp: A Computational Infrastructure for Partially Observable Markov Decision Processes
Many important problems involve decision-making under uncertainty. For example, a medical professional needs to make decisions about the best treatment option based on limited information about the current state of the patient and uncertainty about outcomes. Different approaches have been developed by the applied mathematics, operations research, and artificial intelligence communities to address this difficult class of decision-making problems. This paper presents the pomdp package, which provides a computational infrastructure for an approach called the partially observable Markov decision process (POMDP), which models the problem as a discrete-time stochastic control process. The package lets the user specify POMDPs using familiar R syntax, apply state-of-the-art POMDP solvers, and then take full advantage of R's range of capabilities, including statistical analysis, simulation, and visualization, to work with the resulting models.
Fast and Flexible Search for Homologous Biological Sequences with DECIPHER v3
The rapid growth in available biological sequences makes large-scale analyses increasingly challenging. The DECIPHER package was designed with the objective of helping to manage big biological data, which is even more relevant today than when the package was first introduced. Here, I present DECIPHER version 3 with improvements to sequence databases, as well as fast and flexible sequence search. DECIPHER now allows users to find regions of local similarity between sets of DNA, RNA, or amino acid sequences at high speed. I show the power of DECIPHER v3 by (a) comparing against BLAST and MMseqs2 on a protein homology benchmark, (b) locating nucleotide sequences in a genome, (c) finding the nearest sequences in a reference database, and (d) searching for orthologous sequences common to human and zebrafish genomes. Search hits can be quickly aligned, which enables a variety of downstream applications. These new features of DECIPHER v3 make it easier to manage big biological sequence data.
Remembering Friedrich "Fritz" Leisch
This article remembers our friend and colleague Fritz Leisch (1968--2024) who sadly died earlier this year. Many of the readers of The R Journal will know Fritz as a member of the R Core Team and for many of his contributions to the R community. For us, the co-authors of this article, he was an important companion on our journey with the R project and other scientific endeavours over the years. In the following, we provide a brief synopsis of his career, present his key contributions to the R project and to the scientific community more generally, acknowledge his academic service, and highlight his teaching and mentoring achievements.
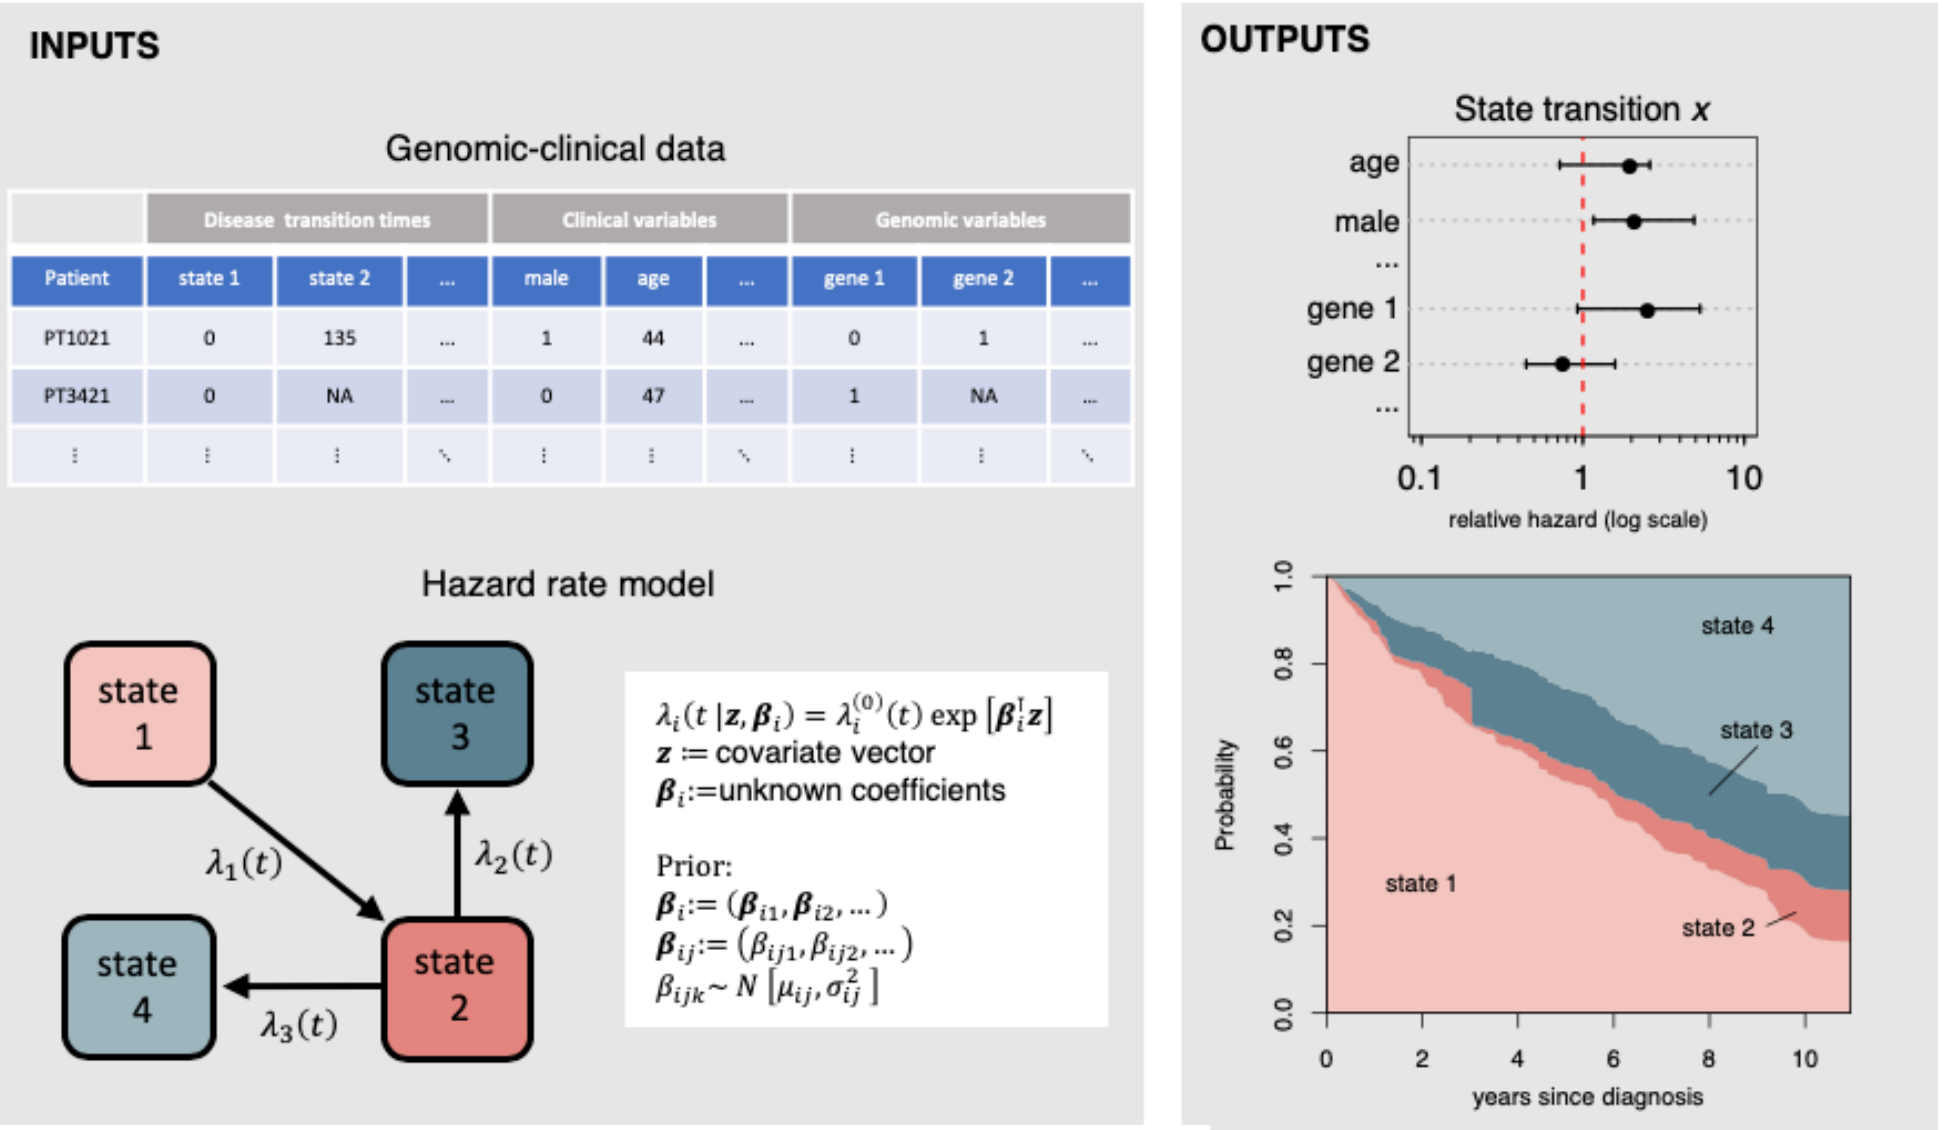
ebmstate: An R Package For Disease Progression Analysis Under Empirical Bayes Cox Models
The new R package ebmstate is a package for multi-state survival analysis. It is suitable for high-dimensional data and allows point and interval estimation of relative transition hazards, cumulative transition hazards and state occupation probabilities, under clock-forward and clock-reset Cox models. Our package extends the package mstate in a threefold manner: it transforms the Cox regression model into an empirical Bayes model that can handle high-dimensional data; it introduces an analytical, Fourier transform-based estimator of state occupation probabilities for clock-reset models that is much faster than the corresponding, simulation-based estimator in mstate; and it replaces asymptotic confidence intervals meant for the low-dimensional setting by non-parametric bootstrap confidence intervals. Our package supports multi-state models of arbitrary structure, but the estimators of state occupation probabilities are valid for transition structures without cycles only. Once the input data is in the required format, estimation is handled automatically. The present paper includes a tutorial on how to use ebmstate to estimate transition hazards and state occupation probabilities, as well as a simulation study showing how it outperforms mstate in higher-dimensional settings.
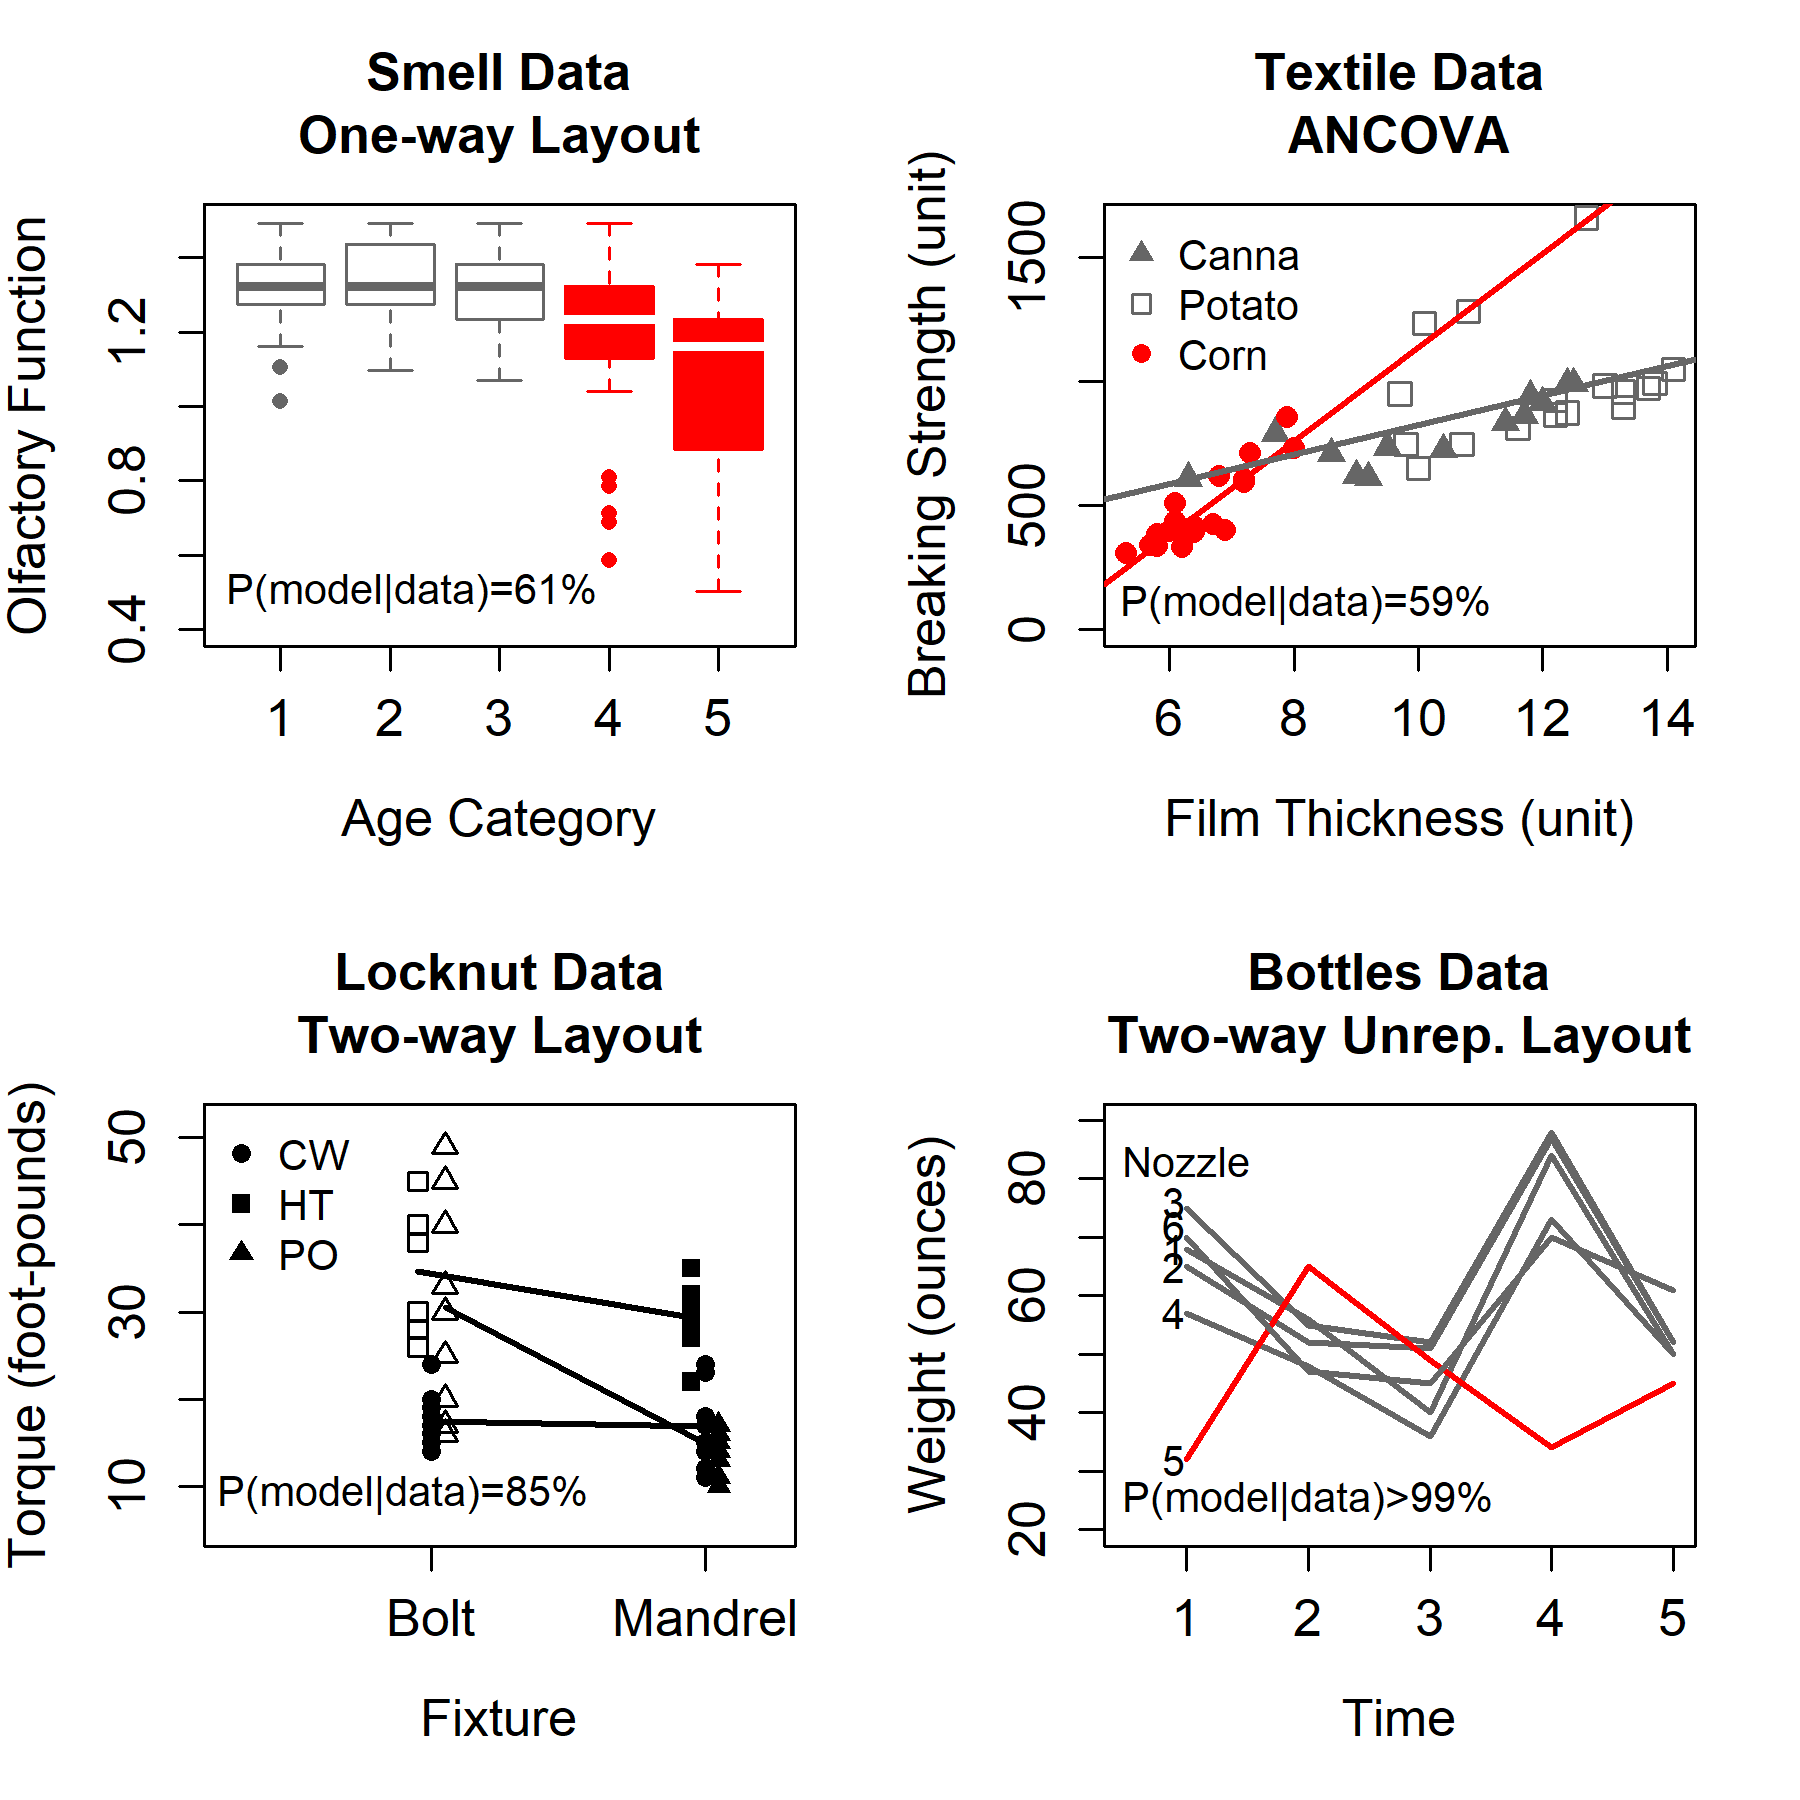
Bayesian Model Selection with Latent Group-Based Effects and Variances with the R Package slgf
Linear modeling is ubiquitous, but performance can suffer when the model is misspecified. We have recently demonstrated that latent groupings in the levels of categorical predictors can complicate inference in a variety of fields including bioinformatics, agriculture, industry, engineering, and medicine. Here we present the R package slgf which enables the user to easily implement our recently-developed approach to detect group-based regression effects, latent interactions, and/or heteroscedastic error variance through Bayesian model selection. We focus on the scenario in which the levels of a categorical predictor exhibit two latent groups. We treat the detection of this grouping structure as an unsupervised learning problem by searching the space of possible groupings of factor levels. First we review the suspected latent grouping factor (SLGF) method. Next, using both observational and experimental data, we illustrate the usage of slgf in the context of several common linear model layouts: one-way analysis of variance (ANOVA), analysis of covariance (ANCOVA), a two-way replicated layout, and a two-way unreplicated layout. We have selected data that reveal the shortcomings of classical analyses to emphasize the advantage our method can provide when a latent grouping structure is present.

BMRMM: An R Package for Bayesian Markov (Renewal) Mixed Models
We introduce the BMRMM package implementing Bayesian inference for a class of Markov renewal mixed models which can characterize the stochastic dynamics of a collection of sequences, each comprising alternative instances of categorical states and associated continuous duration times, while being influenced by a set of exogenous factors as well as a 'random' individual. The default setting flexibly models the state transition probabilities using mixtures of Dirichlet distributions and the duration times using mixtures of gamma kernels while also allowing variable selection for both. Modeling such data using simpler Markov mixed models also remains an option, either by ignoring the duration times altogether or by replacing them with instances of an additional category obtained by discretizing them by a user-specified unit. The option is also useful when data on duration times may not be available in the first place. We demonstrate the package's utility using two data sets.
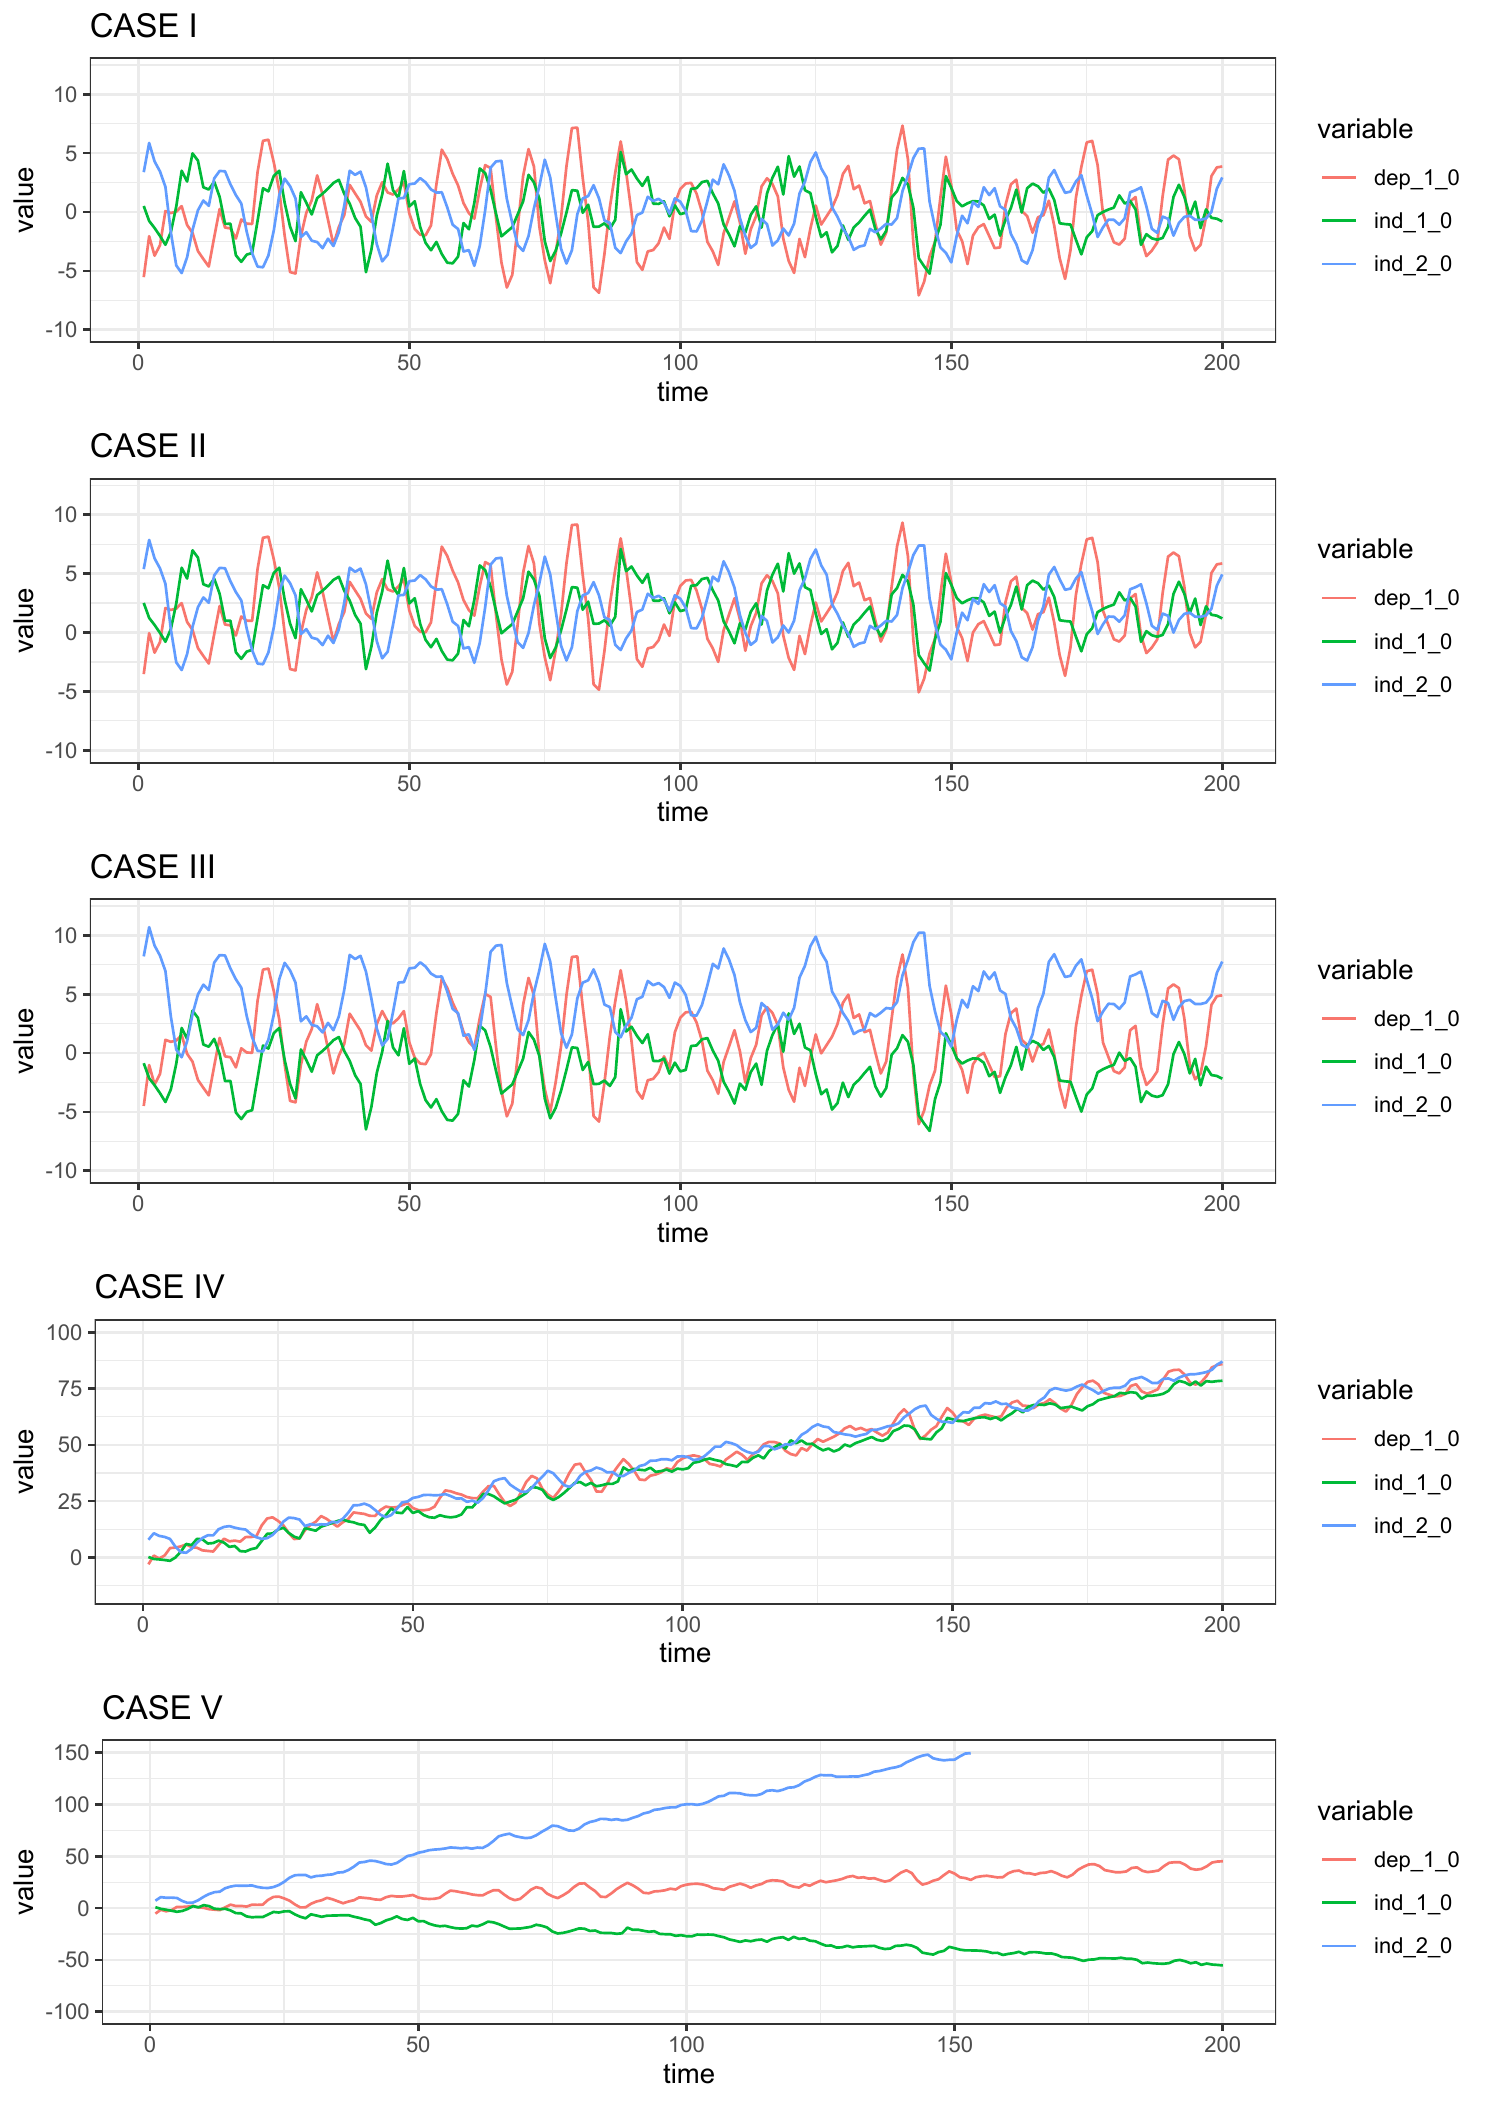
bootCT: An R Package for Bootstrap Cointegration Tests in ARDL Models
The Autoregressive Distributed Lag approach to cointegration or bound testing, proposed by Pesaran in 2001, has become prominent in empirical research. Although this approach has many advantages over the classical cointegration tests, it is not exempt from drawbacks, such as possible inconclusive inference and distortion in size. Recently, Bertelli and coauthors developed a bootstrap approach to the bound tests to overcome these drawbacks. This paper introduces the R package bootCT, which implements this method by deriving the bootstrap versions of the bound tests and of the asymptotic F-test on the independent variables proposed by Sam and coauthors in 2019. As a spinoff, a general method for generating random multivariate time series following a given VECM/ARDL structure is provided in the package. Empirical applications showcase the main functionality of the package.
Prediction, Bootstrapping and Monte Carlo Analyses Based on Linear Mixed Models with QAPE 2.0 Package
The paper presents a new R package [**qape**](https://CRAN.R-project.org/package=qape) for prediction, accuracy estimation of various predictors and Monte Carlo simulation studies of properties of both predictors and estimators of accuracy measures. It allows to predict any population and subpopulation characteristics of the response variable based on the Linear Mixed Model (LMM). The response variable can be transformed, e.g. to logarithm and the data can be in the cross-sectional or longitudinal framework. Three bootstrap algorithms are developed: parametric, residual and double, allowing to estimate the prediction accuracy. Analyses can also include Monte Carlo simulation studies of properties of the methods used. Unlike other packages, in the prediction process the user can flexibly define the predictor, the model, the transformation function of the response variable, the predicted characteristics and the method of accuracy estimation.

text2sdg: An R Package to Monitor Sustainable Development Goals from Text
Monitoring progress on the United Nations Sustainable Development Goals (SDGs) is important for both academic and non-academic organizations. Existing approaches to monitoring SDGs have focused on specific data types; namely, publications listed in proprietary research databases. We present the text2sdg package for the R language, a user-friendly, open-source package that detects SDGs in text data using different individual query systems, an ensemble of query systems, or custom-made ones. The text2sdg package thereby facilitates the monitoring of SDGs for a wide array of text sources and provides a much-needed basis for validating and improving extant methods to detect SDGs from text.
GenMarkov: Modeling Generalized Multivariate Markov Chains in R
This article proposes a new generalization of the Multivariate Markov Chains (MMC) model. The future values of a Markov chain commonly depend on only the past values of the chain in an autoregressive fashion. The generalization proposed in this work also considers exogenous variables that can be deterministic or stochastic. Furthermore, the effects of the MMC's past values and the effects of pre-determined or exogenous covariates are considered in our model by considering a non-homogeneous Markov chain. The Monte Carlo simulation study findings showed that our model consistently detected a non-homogeneous Markov chain. Besides, an empirical illustration demonstrated the relevance of this new model by estimating probability transition matrices over the space state of the exogenous variable. An additional and practical contribution of this work is the development of a novel R package with this generalization.

Fitting a Quantile Regression Model for Residual Life with the R Package qris
In survival analysis, regression modeling has traditionally focused on assessing covariate effects on survival times, which is defined as the elapsed time between a baseline and event time. Nevertheless, focusing on residual life can provide a more dynamic assessment of covariate effects, as it offers more updated information at specific time points between the baseline and event occurrence. Statistical methods for fitting quantile regression models have recently been proposed, providing favorable alternatives to modeling the mean of residual lifetimes. Despite these progresses, the lack of computer software that implements these methods remains an obstacle for researchers analyzing data in practice. In this paper, we introduce an R package qris, which implements methods for fitting semiparametric quantile regression models on residual life subject to right censoring. We demonstrate the effectiveness and versatility of this package through comprehensive simulation studies and a real-world data example, showcasing its valuable contributions to survival analysis research.
nortsTest: An R Package for Assessing Normality of Stationary Processes
Normality is the central assumption for analyzing dependent data in several time series models, and the literature has widely studied normality tests. However, the implementations of these tests are limited. The nortsTest package is dedicated to fill this void. The package performs the asymptotic and bootstrap versions of the tests of Epps and Lobato and Velasco and the tests of Psaradakis and Vavra, random projections and El Bouch for normality of stationary processes. These tests are for univariate stationary processes but for El Bouch that also allows bivariate stationary processes. In addition, the package offers visual diagnostics for checking stationarity and normality assumptions for the most used time series models in several R packages. This work aims to show the package's functionality, presenting each test performance with simulated examples and the package utility for model diagnostic in time series analysis.
shinymgr: A Framework for Building, Managing, and Stitching Shiny Modules into Reproducible Workflows
The R package shinymgr provides a unifying framework that allows Shiny developers to create, manage, and deploy a master Shiny application comprised of one or more "apps", where an "app" is a tab-based workflow that guides end-users through a step-by-step analysis. Each tab in a given "app" consists of one or more Shiny modules. The shinymgr app builder allows developers to "stitch" Shiny modules together so that outputs from one module serve as inputs to the next, creating an analysis pipeline that is easy to implement and maintain. Apps developed using shinymgr can be incorporated into R packages or deployed on a server, where they are accessible to end-users. Users of shinymgr apps can save analyses as an RDS file that fully reproduces the analytic steps and can be ingested into an RMarkdown or Quarto report for rapid reporting. In short, developers use the shinymgr framework to write Shiny modules and seamlessly combine them into Shiny apps, and end-users of these apps can execute reproducible analyses that can be incorporated into reports for rapid dissemination. A comprehensive overview of the package is provided by 12 learnr tutorials.
exvatools: Value Added in Exports and Other Input-Output Table Analysis Tools
This article introduces an R package, exvatools, that simplifies the analysis of trade in value added with international input-output tables. It provides a full set of commands for data extraction, matrix creation and manipulation, decomposition of value added in gross exports (using alternative methodologies) and a straightforward calculation of many value added indicators. It can handle both raw data from well-known public input-output databases and custom data. It has a wide sector and geographical flexibility and can be easily expanded and adapted to specific economic analysis needs, facilitating a better understanding and a wider use of the available statistical resources to study globalization.

SUrvival Control Chart EStimation Software in R: the success Package
Monitoring the quality of statistical processes has been of great importance, mostly in industrial applications. Control charts are widely used for this purpose, but often lack the ability to monitor survival outcomes. Recently, inspecting survival outcomes has become of interest, especially in medical settings where outcomes often depend on risk factors of patients. For this reason many new survival control charts have been devised and existing ones have been extended to incorporate survival outcomes. The package `success` allows users to construct risk-adjusted control charts for survival data. Functions to determine control chart parameters are included, which can be used even without expert knowledge on the subject of control charts. The package allows to create static as well as interactive charts, which are built using `ggplot2` [@ggplot2R] and `plotly` [@plotlyR].
SIMEXBoost: An R package for Analysis of High-Dimensional Error-Prone Data Based on Boosting Method
Boosting is a powerful statistical learning method. Its key feature is the ability to derive a strong learner from simple yet weak learners by iteratively updating the learning results. Moreover, boosting algorithms have been employed to do variable selection and estimation for regression models. However, measurement error usually appears in covariates. Ignoring measurement error can lead to biased estimates and wrong inferences. To the best of our knowledge, few packages have been developed to address measurement error and variable selection simultaneously by using boosting algorithms. In this paper, we introduce an R package [SIMEXBoost](https://CRAN.R-project.org/package=SIMEXBoost), which covers some widely used regression models and applies the simulation and extrapolation method to deal with measurement error effects. Moreover, the package [SIMEXBoost](https://CRAN.R-project.org/package=SIMEXBoost) enables us to do variable selection and estimation for high-dimensional data under various regression models. To assess the performance and illustrate the features of the package, we conduct numerical studies.
binGroup2: Statistical Tools for Infection Identification via Group Testing
Group testing is the process of testing items as an amalgamation, rather than separately, to determine the binary status for each item. Its use was especially important during the COVID-19 pandemic through testing specimens for SARS-CoV-2. The adoption of group testing for this and many other applications is because members of a negative testing group can be declared negative with potentially only one test. This subsequently leads to significant increases in laboratory testing capacity. Whenever a group testing algorithm is put into practice, it is critical for laboratories to understand the algorithm's operating characteristics, such as the expected number of tests. Our paper presents the [binGroup2](https://CRAN.R-project.org/package=binGroup2) package that provides the statistical tools for this purpose. This R package is the first to address the identification aspect of group testing for a wide variety of algorithms. We illustrate its use through COVID-19 and chlamydia/gonorrhea applications of group testing.
multiocc: An R Package for Spatio-Temporal Occupancy Models for Multiple Species
Spatio-temporal occupancy models are used to model the presence or absence of a species at particular locations and times, while accounting for dependence in both space and time. Multivariate extensions can be used to simultaneously model multiple species, which introduces another dimension to the dependence structure in the data. In this paper we introduce multiocc, an `R` package for fitting multivariate spatio-temporal occupancy models. We demonstrate the use of this package fitting the multi-species spatio-temporal occupancy model to data on six species of birds from the Swiss MHB Breeding Bird Survey.

Accessible Computation of Tight Symbolic Bounds on Causal Effects using an Intuitive Graphical Interface
Strong untestable assumptions are almost universal in causal point estimation. In particular settings, bounds can be derived to narrow the possible range of a causal effect. Symbolic bounds apply to all settings that can be depicted using the same directed acyclic graph and for the same effect of interest. Although the core of the methodology for deriving symbolic bounds has been previously developed, the means of implementation and computation have been lacking. Our R-package causaloptim aims to solve this usability problem by providing the user with a graphical interface through Shiny. This interface takes input in a form that most researchers with an interest in causal inference will be familiar: a graph drawn in the user's web browser and a causal query written in text using common counterfactual notation.

singR: An R Package for Simultaneous Non-Gaussian Component Analysis for Data Integration
This paper introduces an R package singR that implements Simultaneous non-Gaussian Component Analysis (SING) for data integration. SING uses a non-Gaussian measure of information to extract feature loadings and scores (latent variables) that are shared across multiple datasets. We describe the functions implemented in singR and showcase their use on two examples. The first example is a toy example working with images. The second example is a simulated study integrating functional connectivity estimates from a resting-state functional magnetic resonance imaging dataset and task activation maps from a working memory functional magnetic resonance imaging dataset. The SING model can produce joint components that accurately reflect information shared by multiple datasets, particularly for datasets with non-Gaussian features such as neuroimaging.
RobustCalibration: Robust Calibration of Computer Models in R
Two fundamental research tasks in science and engineering are forward predictions and data inversion. This article introduces a new R package [RobustCalibration](https://CRAN.R-project.org/package=RobustCalibration) for Bayesian data inversion and model calibration using experiments and field observations. Mathematical models for forward predictions are often written in computer code, and they can be computationally expensive to run. To overcome the computational bottleneck from the simulator, we implemented a statistical emulator from the [RobustGaSP](https://CRAN.R-project.org/package=RobustGaSP) package for emulating both scalar-valued or vector-valued computer model outputs. Both posterior sampling and maximum likelihood approach are implemented in the [RobustCalibration](https://CRAN.R-project.org/package=RobustCalibration) package for parameter estimation. For imperfect computer models, we implement the Gaussian stochastic process and scaled Gaussian stochastic process for modeling the discrepancy function between the reality and mathematical model. This package is applicable to various other types of field observations and models, such as repeated experiments, multiple sources of measurements and correlated measurement bias. We discuss numerical examples of calibrating mathematical models that have closed-form expressions, and differential equations solved by numerical methods.
glmmPen: High Dimensional Penalized Generalized Linear Mixed Models
Generalized linear mixed models (GLMMs) are widely used in research for their ability to model correlated outcomes with non-Gaussian conditional distributions. The proper selection of fixed and random effects is a critical part of the modeling process since model misspecification may lead to significant bias. However, the joint selection of fixed and random effects has historically been limited to lower-dimensional GLMMs, largely due to the use of criterion-based model selection strategies. Here we present the R package glmmPen, one of the first to select fixed and random effects in higher dimension using a penalized GLMM modeling framework. Model parameters are estimated using a Monte Carlo Expectation Conditional Minimization (MCECM) algorithm, which leverages Stan and RcppArmadillo for increased computational efficiency. Our package supports the Binomial, Gaussian, and Poisson families and multiple penalty functions. In this manuscript we discuss the modeling procedure, estimation scheme, and software implementation through application to a pancreatic cancer subtyping study. Simulation results show our method has good performance in selecting both the fixed and random effects in high dimensional GLMMs.
Unified ROC Curve Estimator for Diagnosis and Prognosis Studies: The sMSROC Package
The binary classification problem is a hot topic in Statistics. Its close relationship with the diagnosis and the prognosis of diseases makes it crucial in biomedical research. In this context, it is important to identify biomarkers that may help to classify individuals into different classes, for example, diseased vs. not diseased. The Receiver Operating-Characteristic (ROC) curve is a graphical tool commonly used to assess the accuracy of such classification. Given the diverse nature of diagnosis and prognosis problems, the ROC curve estimation has been tackled from separate perspectives in each setting. The Two-stages Mixed-Subjects (sMS) ROC curve estimator fits both scenarios. Besides, it can handle data with missing or incomplete outcome values. This paper introduces the [R](R){.uri} package sMSROC which implements the sMS ROC estimator, and includes tools that may support researchers in their decision making. Its practical application is illustrated on three real-world datasets.

Sparse Model Matrices for Multidimensional Hierarchical Aggregation
Multidimensional hierarchical sum aggregations can be formulated as matrix multiplications involving dummy matrices which can be referred to as model matrices. In contrast to standard model matrices, all categories of all variables must be included. For this purpose, the R package SSBtools includes functionality to create model matrices in two alternative ways, by model formulas or by so-called hierarchies. The latter means a coding of hierarchical relationships, and this can be done in several ways. Tree-shaped hierarchies are not required. The internal standard in the package is a parent-child coding. Functionality to find hierarchies automatically from the data is also included. The model matrix functionality is applied in several R packages for statistical disclosure control. This enables general implementation of methods and a flexible user interface. This paper describes the model matrix and hierarchy functions in SSBtools, as well as the methods and functions behind it.
openalexR: An R-Tool for Collecting Bibliometric Data from OpenAlex
Bibliographic databases are indispensable sources of information on published literature. OpenAlex is an open-source collection of academic metadata that enable comprehensive bibliographic analyses [@priem2022openalex]. In this paper, we provide details on the implementation of openalexR, an R package to interface with the OpenAlex API. We present a general overview of its main functions and several detailed examples of its use. Following best API package practices, openalexR offers an intuitive interface for collecting information on different entities, including works, authors, institutions, sources, and concepts. openalexR exposes to the user different API parameters including filtering, searching, sorting, and grouping. This new open-source package is well-documented and available on CRAN.

Computer Algebra in R Bridges a Gap Between Symbolic Mathematics and Data in the Teaching of Statistics and Data Science
The capability of R to do symbolic mathematics is enhanced by the reticulate and caracas packages. The workhorse behind these packages is the Python computer algebra library SymPy. Via reticulate, the SymPy library can be accessed from within R. This, however, requires some knowledge of SymPy, Python and reticulate. The caracas package, on the other hand, provides access to SymPy (via reticulate) but by using R syntax, and this is the main contribution of caracas. We show examples of how to use the SymPy library from R via reticulate and caracas. Using caracas, we demonstrate how mathematics and statistics can benefit from bridging computer algebra and data via R. The caracas package integrates well with Rmarkdown and Quarto, and as such supports creation of teaching material and scientific reports. As inspiration for teachers, we include ideas for small student projects.

A Comparison of R Tools for Nonlinear Least Squares Modeling
Our Google Summer of Code project "Improvements to `nls()`" investigated rationalizing R tools for nonlinear regression and nonlinear estimation tools by considering usability, maintainability, and functionality, especially for a Gauss-Newton solver. <!-- JN: copyedit essentially accepted --> The rich features of `nls()` are weakened by several deficiencies and inconsistencies such as a lack of stabilization of the Gauss-Newton solver. Further considerations are the usability and maintainability of the code base that provides the functionality `nls()` claims to offer. Various packages, including our `nlsr`, provide alternative capabilities. We consider the differences in goals, approaches, and features of different tools for nonlinear least squares modeling in R. Discussion of these matters is relevant to improving R generally as well as its nonlinear estimation tools.
PLreg: An R Package for Modeling Bounded Continuous Data
The power logit class of distributions is useful for modeling continuous data on the unit interval, such as fractions and proportions. It is very flexible and the parameters represent the median, dispersion and skewness of the distribution. Based on the power logit class, Queiroz and Ferrari (2023b, *Statistical Modelling*) proposed the power logit regression models. The dependent variable is assumed to have a distribution in the power logit class, with its median and dispersion linked to regressors through linear predictors with unknown coefficients. We present the R package **PLreg** which implements a suite of functions for working with power logit class of distributions and the associated regression models. This paper describes and illustrates the methods and algorithms implemented in the package, including tools for parameter estimation, diagnosis of fitted models, and various helper functions for working with power logit distributions, including density, cumulative distribution, quantile, and random number generating functions. Additional examples are presented to show the ability of the **PLreg** package to fit generalized Johnson SB, log-log, and inflated power logit regression models.
Inference for Network Count Time Series with the R Package PNAR
We introduce a new R package useful for inference about network count time series. Such data are frequently encountered in statistics and they are usually treated as multivariate time series. Their statistical analysis is based on linear or log-linear models. Nonlinear models, which have been applied successfully in several research areas, have been neglected from such applications mainly because of their computational complexity. We provide R users the flexibility to fit and study nonlinear network count time series models which include either a drift in the intercept or a regime switching mechanism. We develop several computational tools including estimation of various count Network Autoregressive models and fast computational algorithms for testing linearity in standard cases and when non-identifiable parameters hamper the analysis. Finally, we introduce a copula Poisson algorithm for simulating multivariate network count time series. We illustrate the methodology by modeling weekly number of influenza cases in Germany.
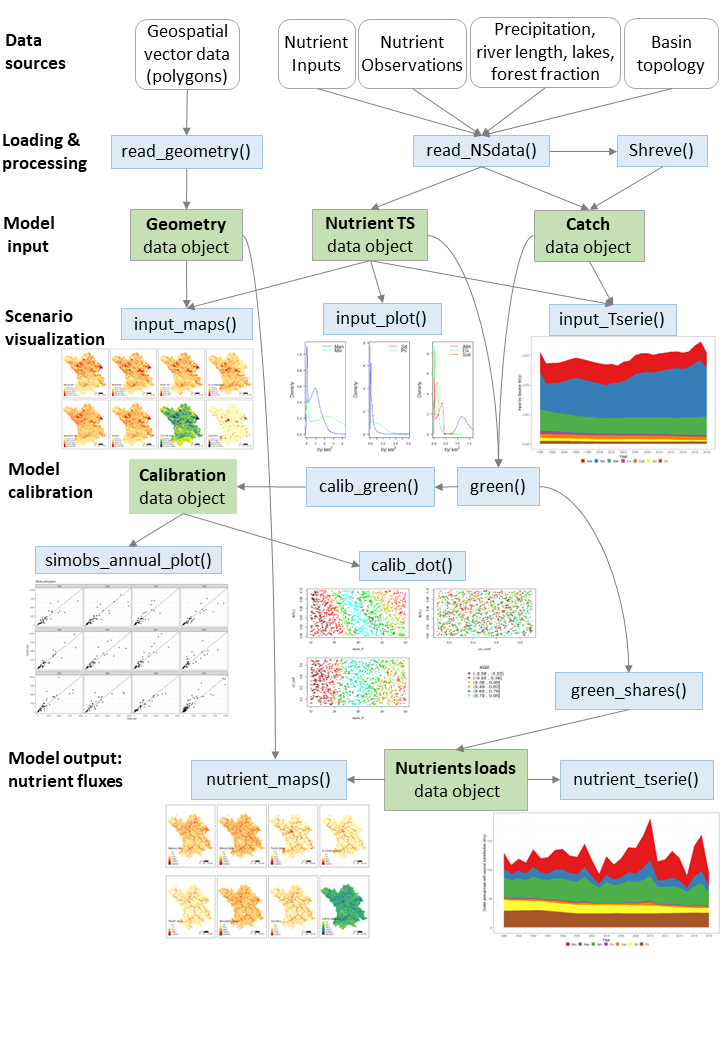
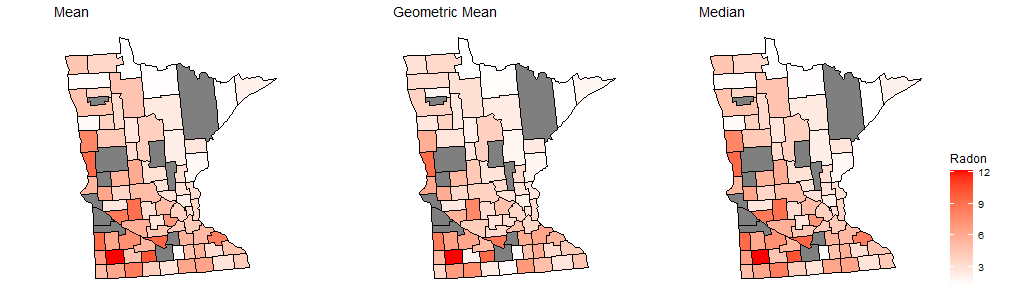
GREENeR: An R Package to Estimate and Visualize Nutrients Pressures on Surface Waters
Nutrient pollution affects fresh and coastal waters around the globe. Planning mitigating actions requires tools to assess fluxes of nutrient emissions to waters and expected restoration impacts. Conceptual river basin models take advantage of data on nutrient emissions and concentrations at monitoring stations, providing a physical interpretation of monitored conditions, and enabling scenario analysis. The GREENeR package streamlines water quality model in a region of interest, considering nutrient pathways and the hydrological structure of the river network. The package merges data sources, analyzes local conditions, calibrate the model, and assesses yearly nutrient levels along the river network, determining contributions of load in freshwaters from diffuse and point sources. The package is enriched with functions to perform thorough parameter sensitivity analysis and for mapping nutrient sources and fluxes. The functionalities of the package are demonstrated using datasets from the Vistula river basin.
Variety and Mainstays of the R Developer Community
The thriving developer community has a significant impact on the widespread use of R software. To better understand this community, we conducted a study analyzing all R packages available on CRAN. We identified the most popular topics of R packages by text mining the package descriptions. Additionally, using network centrality measures, we discovered the important packages in the package dependency network and influential developers in the global R community. Our analysis showed that among the 20 topics identified in the topic model, *Data Import, Export, and Wrangling*, as well as *Data Visualization, Result Presentation, and Interactive Web Applications*, were particularly popular among influential packages and developers. These findings provide valuable insights into the R community.
SSNbayes: An R Package for Bayesian Spatio-Temporal Modelling on Stream Networks
Spatio-temporal models are widely used in many research areas from ecology to epidemiology. However, a limited number of computational tools are available for modeling river network datasets in space and time. In this paper, we introduce the `R` package [SSNbayes](https://CRAN.R-project.org/package=SSNbayes) for fitting Bayesian spatio-temporal models and making predictions on branching stream networks. [SSNbayes](https://CRAN.R-project.org/package=SSNbayes) provides a linear regression framework with multiple options for incorporating spatial and temporal autocorrelation. Spatial dependence is captured using stream distance and flow connectivity while temporal autocorrelation is modelled using vector autoregression approaches. [SSNbayes](https://CRAN.R-project.org/package=SSNbayes) provides the functionality to make predictions across the whole network, compute exceedance probabilities, and other probabilistic estimates, such as the proportion of suitable habitat. We illustrate the functionality of the package using a stream temperature dataset collected in the Clearwater River Basin, USA.
C443: An R package to See a Forest for the Trees
Classification trees, well-known for their ease of interpretation, are a widely used tool to solve statistical learning problems. However, researchers often end up with a forest rather than an individual classification tree, which implies a major cost due to the loss of the transparency of individual trees. Therefore, an important challenge is to enjoy the benefits of forests without paying this cost. In this paper, we propose the R package C443. The C443 methodology simplifies a forest into one or a few condensed summary trees, to gain insight into its central tendency and heterogeneity. This is done by clustering the trees in the forest based on similarities between them, and on post-processing the clustering output. We will elaborate upon the implementation of the methodology in the package, and will illustrate its use with three examples.
TwoSampleTest.HD: An R Package for the Two-Sample Problem with High-Dimensional Data
The two-sample problem refers to the comparison of two probability distributions via two independent samples. With high-dimensional data, such comparison is performed along a large number $p$ of possibly correlated variables or outcomes. In genomics, for instance, the variables may represent gene expression levels for $p$ locations, recorded for two (usually small) groups of individuals. In this paper we introduce [TwoSampleTest.HD](https://CRAN.R-project.org/package=TwoSampleTest.HD), a new `R` package to test for the equal distribution of the $p$ outcomes. Specifically, TwoSampleTest.HD implements the tests recently proposed by [@Marta2] for the low sample size, large dimensional setting. These tests take the possible dependence among the $p$ variables into account, and work for sample sizes as small as two. The tests are based on the distance between the empirical characteristic functions of the two samples, when averaged along the $p$ locations. Different options to estimate the variance of the test statistic under dependence are allowed. The package TwoSampleTest.HD provides the user with individual permutation $p$-values too, so feature discovery is possible when the null hypothesis of equal distribution is rejected. We illustrate the usage of the package through the analysis of simulated and real data, where results provided by alternative approaches are considered for comparison purposes. In particular, benefits of the implemented tests relative to ordinary multiple comparison procedures are highlighted. Practical recommendations are given.

Statistical Models for Repeated Categorical Ratings: The R Package rater
A common problem in many disciplines is the need to assign a set of items into categories or classes with known labels. This is often done by one or more expert raters, or sometimes by an automated process. If these assignments or 'ratings' are difficult to make accurately, a common tactic is to repeat them by different raters, or even by the same rater multiple times on different occasions. We present an R package rater, available on CRAN, that implements Bayesian versions of several statistical models for analysis of repeated categorical rating data. Inference is possible for the true underlying (latent) class of each item, as well as the accuracy of each rater. The models are extensions of, and include, the Dawid--Skene model, and we implemented them using the Stan probabilistic programming language. We illustrate the use of rater through a few examples. We also discuss in detail the techniques of marginalisation and conditioning, which are necessary for these models but also apply more generally to other models implemented in Stan.
bayesassurance: An R Package for Calculating Sample Size and Bayesian Assurance
In this paper, we present bayesassurance, an [R]{.sans-serif} package designed for computing Bayesian assurance criteria which can be used to determine sample size in Bayesian inference setting. The functions included in the [R]{.sans-serif} package offer a two-stage framework using design priors to specify the population from which the data will be collected and analysis priors to fit a Bayesian model. We also demonstrate that frequentist sample size calculations are exactly reproduced as special cases of evaluating Bayesian assurance functions using appropriately specified priors.
fasano.franceschini.test: An Implementation of a Multivariate KS Test in R
The Kolmogorov--Smirnov (KS) test is a nonparametric statistical test used to test for differences between univariate probability distributions. The versatility of the KS test has made it a cornerstone of statistical analysis across many scientific disciplines. However, the test proposed by Kolmogorov and Smirnov does not easily extend to multivariate distributions. Here we present the [fasano.franceschini.test](https://CRAN.R-project.org/package=fasano.franceschini.test) package, an R implementation of a multivariate two-sample KS test described by @ff1987. The fasano.franceschini.test package provides a test that is computationally efficient, applicable to data of any dimension and type (continuous, discrete, or mixed), and that performs competitively with similar R packages.
Bayesian Inference for Multivariate Spatial Models with INLA
Bayesian methods and software for spatial data analysis are well-established now in the broader scientific community generally and in the spatial data analysis community specifically. Despite the wide application of spatial models, the analysis of multivariate spatial data using the integrated nested Laplace approximation through its R package (R-INLA) has not been widely described in the existing literature. Therefore, the main objective of this article is to demonstrate that R-INLA is a convenient toolbox to analyse different types of multivariate spatial datasets. This will be illustrated by analysing three datasets which are publicly available. Furthermore, the details and the R code of these analyses are provided to exemplify how to fit models to multivariate spatial datasets with R-INLA.
Two-Stage Sampling Design and Sample Selection with the R Package R2BEAT
R2BEAT ("R 'to' Bethel Extended Allocation for Two-stage sampling") is an R package for the optimal allocation of a sample. Its peculiarity lies in properly addressing allocation problems for two-stage and complex sampling designs with multi-domain and multi-purpose aims. This is common in many official and non-official statistical surveys, therefore R2BEAT could become an essential tool for planning a sample survey. The functions implemented in R2BEAT allow the use of different workflows, depending on the available information on one or more interest variables. The package covers all the phases, from the optimization of the sample to the selection of the Primary and Secondary Stage Units. Furthermore, it provides several outputs for evaluating the allocation results.
fnets: An R Package for Network Estimation and Forecasting via Factor-Adjusted VAR Modelling
Vector autoregressive (VAR) models are useful for modelling high-dimensional time series data. This paper introduces the package [fnets](https://CRAN.R-project.org/package=fnets), which implements the suite of methodologies proposed by [@barigozzi2022fnets] for the network estimation and forecasting of high-dimensional time series under a factor-adjusted vector autoregressive model, which permits strong spatial and temporal correlations in the data. Additionally, we provide tools for visualising the networks underlying the time series data after adjusting for the presence of factors. The package also offers data-driven methods for selecting tuning parameters including the number of factors, the order of autoregression, and thresholds for estimating the edge sets of the networks of interest in time series analysis. We demonstrate various features of fnets on simulated datasets as well as real data on electricity prices.

Coloring in R's Blind Spot
Prior to version 4.0.0 R had a poor default color palette (using highly saturated red, green, blue, etc.) and provided very few alternative palettes, most of which also had poor perceptual properties (like the infamous rainbow palette). Starting with version 4.0.0 R gained a new and much improved default palette and, in addition, a selection of more than 100 well-established palettes are now available via the functions `palette.colors()` and `hcl.colors()`. The former provides a range of popular qualitative palettes for categorical data while the latter closely approximates many popular sequential and diverging palettes by systematically varying the perceptual hue, chroma, and luminance (HCL) properties in the palette. This paper provides a mix of contributions including an overview of the new color functions and the palettes they provide along with advice about which palettes are appropriate for specific tasks, especially with regard to making them accessible to viewers with color vision deficiencies.

Updates to the R Graphics Engine: One Person's Chart Junk is Another's Chart Treasure
Starting from R version 4.1.0, the R graphics engine has gained support for gradient fills, pattern fills, clipping paths, masks, compositing operators, and stroked and filled paths. This document provides a basic introduction to each of these new features and demonstrates how to use the new features in R.
mathml: Translate R Expressions to MathML and LaTeX
This R package translates R objects to suitable elements in MathML or LaTeX, thereby allowing for a pretty mathematical representation of R objects and functions in data analyses, scientific reports and interactive web content. In the R Markdown document rendering language, R code and mathematical content already exist side-by-side. The present package enables use of the same R objects for both data analysis and typesetting in documents or web content. This tightens the link between the statistical analysis and its verbal description or symbolic representation, which is another step towards reproducible science. User-defined hooks enable extension of the package by mapping specific variables or functions to new MathML and LaTeX entities. Throughout the paper, examples are given for the functions of the package, and a case study illustrates its use in a scientific report.
Three-Way Correspondence Analysis in R
Three-way correspondence analysis is a suitable multivariate method for visualising the association in three-way categorical data, modelling the global dependence, or reducing dimensionality. This paper provides a description of an R package for performing three-way correspondence analysis: CA3variants. The functions in this package allow the analyst to perform several variations of this analysis, depending on the research question being posed and/or the properties underlying the data. Users can opt for the classical (symmetrical) approach or the non-symmetric variant - the latter is particularly useful if one of the three categorical variables is treated as a response variable. In addition, to perform the necessary three-way decompositions, a Tucker3 and a trivariate moment decomposition (using orthogonal polynomials) can be utilized. The Tucker3 method of decomposition can be used when one or more of the categorical variables is nominal while for ordinal variables the trivariate moment decomposition can be used. The package also provides a function that can be used to choose the model dimensionality.
nlstac: Non-Gradient Separable Nonlinear Least Squares Fitting
A new package for nonlinear least squares fitting is introduced in this paper. This package implements a recently developed algorithm that, for certain types of nonlinear curve fitting, reduces the number of nonlinear parameters to be fitted. One notable feature of this method is the absence of initialization which is typically necessary for nonlinear fitting gradient-based algorithms. Instead, just some bounds for the nonlinear parameters are required. Even though convergence for this method is guaranteed for exponential decay using the max-norm, the algorithm exhibits remarkable robustness, and its use has been extended to a wide range of functions using the Euclidean norm. Furthermore, this data-fitting package can also serve as a valuable resource for providing accurate initial parameters to other algorithms that rely on them.
Estimating Heteroskedastic and Instrumental Variable Models for Binary Outcome Variables in R
The objective of this article is to introduce the package Rchoice which provides functionality for estimating heteroskedastic and instrumental variable models for binary outcomes, whith emphasis on the calculation of the average marginal effects. To do so, I introduce two new functions of the Rchoice package using widely known applied examples. I also show how users can generate publication-ready tables of regression model estimates.
A Workflow for Estimating and Visualising Excess Mortality During the COVID-19 Pandemic
COVID-19 related deaths estimates underestimate the pandemic burden on mortality because they suffer from completeness and accuracy issues. Excess mortality is a popular alternative, as it compares the observed number of deaths versus the number that would be expected if the pandemic did not occur. The expected number of deaths depends on population trends, temperature, and spatio-temporal patterns. In addition to this, high geographical resolution is required to examine within country trends and the effectiveness of the different public health policies. In this tutorial, we propose a workflow using R for estimating and visualising excess mortality at high geographical resolution. We show a case study estimating excess deaths during 2020 in Italy. The proposed workflow is fast to implement and allows for combining different models and presenting aggregated results based on factors such as age, sex, and spatial location. This makes it a particularly powerful and appealing workflow for online monitoring of the pandemic burden and timely policy making.
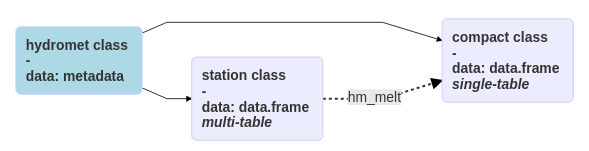
hydrotoolbox, a Package for Hydrometeorological Data Management
The hydrometeorological data provided by federal agencies, research groups and private companies tend to be heterogeneous: records are kept in different formats, quality control processes are not standardized and may even vary within a given agency, variables are not always recorded with the same temporal resolution, and there are data gaps and incorrectly recorded values. Once these problems are dealt with, it is useful to have tools to safely store and manipulate the series, providing temporal aggregation, interactive visualization for analysis, static graphics to publish and/or communicate results, techniques to correct and/or modify the series, among others. Here we introduce a package written in the R language using object-oriented programming and designed to accomplish these objectives, giving to the user a general framework for working with any kind of hydrometeorological series. We present the package design, its strengths, limitations and show its application for two real cases.

bqror: An R package for Bayesian Quantile Regression in Ordinal Models
This article describes an R package [bqror](https://CRAN.R-project.org/package=bqror) that estimates Bayesian quantile regression in ordinal models introduced in Rahman (2016). The paper classifies ordinal models into two types and offers computationally efficient yet simple Markov chain Monte Carlo (MCMC) algorithms for estimating ordinal quantile regression. The generic ordinal model with 3 or more outcomes (labeled $OR_{I}$ model) is estimated by a combination of Gibbs sampling and Metropolis-Hastings algorithm, whereas an ordinal model with exactly 3 outcomes (labeled $OR_{II}$ model) is estimated using a Gibbs sampling algorithm only. In line with the Bayesian literature, we suggest using the marginal likelihood for comparing alternative quantile regression models and explain how to compute it. The models and their estimation procedures are illustrated via multiple simulation studies and implemented in two applications. The article also describes several functions contained within the [bqror](https://CRAN.R-project.org/package=bqror) package, and illustrates their usage for estimation, inference, and assessing model fit.

Gaussian Mixture Models in R
Gaussian mixture models (GMMs) are widely used for modelling stochastic problems. Indeed, a wide diversity of packages have been developed in R. However, no recent review describing the main features offered by these packages and comparing their performances has been performed. In this article, we first introduce GMMs and the EM algorithm used to retrieve the parameters of the model and analyse the main features implemented among seven of the most widely used R packages. We then empirically compare their statistical and computational performances in relation with the choice of the initialisation algorithm and the complexity of the mixture. We demonstrate that the best estimation with well-separated components or with a small number of components with distinguishable modes is obtained with REBMIX initialisation, implemented in the [rebmix](https://CRAN.R-project.org/package=rebmix) package, while the best estimation with highly overlapping components is obtained with *k*-means or random initialisation. Importantly, we show that implementation details in the EM algorithm yield differences in the parameters' estimation. Especially, packages [mixtools](https://CRAN.R-project.org/package=mixtools) (Young et al. 2020) and [Rmixmod](https://CRAN.R-project.org/package=Rmixmod) (Langrognet et al. 2021) estimate the parameters of the mixture with smaller bias, while the RMSE and variability of the estimates is smaller with packages [bgmm](https://CRAN.R-project.org/package=bgmm) (Ewa Szczurek 2021) , [EMCluster](https://CRAN.R-project.org/package=EMCluster) (W.-C. Chen and Maitra 2022) , [GMKMcharlie](https://CRAN.R-project.org/package=GMKMcharlie) (Liu 2021), [flexmix](https://CRAN.R-project.org/package=flexmix) (Gruen and Leisch 2022) and [mclust](https://CRAN.R-project.org/package=mclust) (Fraley, Raftery, and Scrucca 2022). The comparison of these packages provides R users with useful recommendations for improving the computational and statistical performance of their clustering and for identifying common deficiencies. Additionally, we propose several improvements in the development of a future, unified mixture model package.
PINstimation: An R Package for Estimating Probability of Informed Trading Models
The purpose of this paper is to introduce the R package [PINstimation](https://CRAN.R-project.org/package=PINstimation). The package is designed for fast and accurate estimation of the probability of informed trading models through the implementation of well-established estimation methods. The models covered are the original PIN model [@easley1992time; @easley1996liquidity], the multilayer PIN model [@ersan2016multilayer], the adjusted PIN model [@duarte2009why], and the volume- synchronized PIN [@Easley2011microstructure; @Easley2012Flow]. These core functionalities of the package are supplemented with utilities for data simulation, aggregation and classification tools. In addition to a detailed overview of the package functions, we provide a brief theoretical review of the main methods implemented in the package. Further, we provide examples of use of the package on trade-level data for 58 Swedish stocks, and report straightforward, comparative and intriguing findings on informed trading. These examples aim to highlight the capabilities of the package in tackling relevant research questions and illustrate the wide usage possibilities of PINstimation for both academics and practitioners.

EviewsR: An R Package for Dynamic and Reproducible Research Using EViews, R, R Markdown and Quarto
EViews is a software designed for conducting econometric data analysis. There exists a one-way communication between EViews and R, as the former can run the code of the latter, but the reverse is not the case. We describe [EviewsR](https://CRAN.R-project.org/package=EviewsR), an R package which allows users of R, R Markdown and Quarto to execute EViews code. In essence, [EviewsR](https://CRAN.R-project.org/package=EviewsR) does not only provide functions for base R, but also adds EViews to the existing [knitr](https://CRAN.R-project.org/package=knitr)'s knit-engines. We also show how EViews equation, graph, series, and table objects can be imported and customised dynamically and reproducibly in R, R Markdown and Quarto document. Therefore, [EviewsR](https://CRAN.R-project.org/package=EviewsR) seeks to improve the accuracy, transparency and reproducibility of research conducted with EViews and R.

langevitour: Smooth Interactive Touring of High Dimensions, Demonstrated with scRNA-Seq Data
langevitour displays interactive animated 2D projections of high-dimensional datasets. Langevin Dynamics is used to produce a smooth path of projections. Projections are initially explored at random. A "guide" can be activated to look for an informative projection, or variables can be manually positioned. After a projection of particular interest has been found, continuing small motions provide a channel of visual information not present in a static scatter plot. langevitour is implemented in Javascript, allowing for a high frame rate and responsive interaction, and can be used directly from the R environment or embedded in HTML documents produced using R. Single cell RNA-sequencing (scRNA-Seq) data is used to demonstrate the widget. langevitour's linear projections provide a less distorted view of this data than commonly used non-linear dimensionality reductions such as UMAP.
mutualinf: An R Package for Computing and Decomposing the Mutual Information Index of Segregation
In this article, we present the R package [mutualinf](https://CRAN.R-project.org/package=mutualinf) for computing and decomposing the mutual information index of segregation by means of recursion and parallelization techniques. The mutual information index is the only multigroup index of segregation that satisfies strong decomposability properties, both for organizational units and groups. The [mutualinf](https://CRAN.R-project.org/package=mutualinf) package contributes by (1) implementing the decomposition of the mutual information index into a "between" and a "within" term; (2) computing, in a single call, a chain of decompositions that involve one "between" term and several "within" terms; (3) providing the contributions of the variables that define the groups or the organizational units to the overall segregation; and (4) providing the demographic weights and local indexes employed in the computation of the "within" term. We illustrate the use of [mutualinf](https://CRAN.R-project.org/package=mutualinf) using Chilean school enrollment data. With these data, we study socioeconomic and ethnic segregation in schools.
ggdensity: Improved Bivariate Density Visualization in R
The [ggdensity](https://CRAN.R-project.org/package=ggdensity) R package extends the functionality of [ggplot2](https://CRAN.R-project.org/package=ggplot2) by providing more interpretable visualizations of bivariate density estimates using highest density regions (HDRs). The visualizations are created via drop-in replacements for the standard [ggplot2](https://CRAN.R-project.org/package=ggplot2) functions used for this purpose: geom_hdr() for geom_density_2d_filled() and geom_hdr_lines() for geom_density_2d(). These new geoms improve on those of [ggplot2](https://CRAN.R-project.org/package=ggplot2) by communicating the probabilities associated with the displayed regions. Various statistically rigorous estimators are available, as well as convenience functions geom_hdr_fun() and geom_hdr_fun_lines() for plotting HDRs of user-specified probability density functions. Associated geoms for rug plots and pointdensity scatterplots are also presented.
genpathmox: An R Package to Tackle Numerous Categorical Variables and Heterogeneity in Partial Least Squares Structural Equation Modeling
Partial least squares structural equation modeling (PLS-SEM), combined with the analysis of the effects of categorical variables after estimating the model, is a well-established statistical approach to the study of complex relationships between variables. However, the statistical methods and software packages available are limited when we are interested in assessing the effects of several categorical variables and shaping different groups following different models. Following the framework established by @Lamberti16, we have developed the [genpathmox](https://CRAN.R-project.org/package=genpathmox) *R* package for handling a large number of categorical variables when faced with heterogeneity in PLS-SEM. The package has functions for various aspects of the analysis of heterogeneity in PLS-SEM models, including estimation, visualization, and hypothesis testing. In this paper, we describe the implementation of genpathmox in detail and demonstrate its usefulness by analyzing employee satisfaction data.
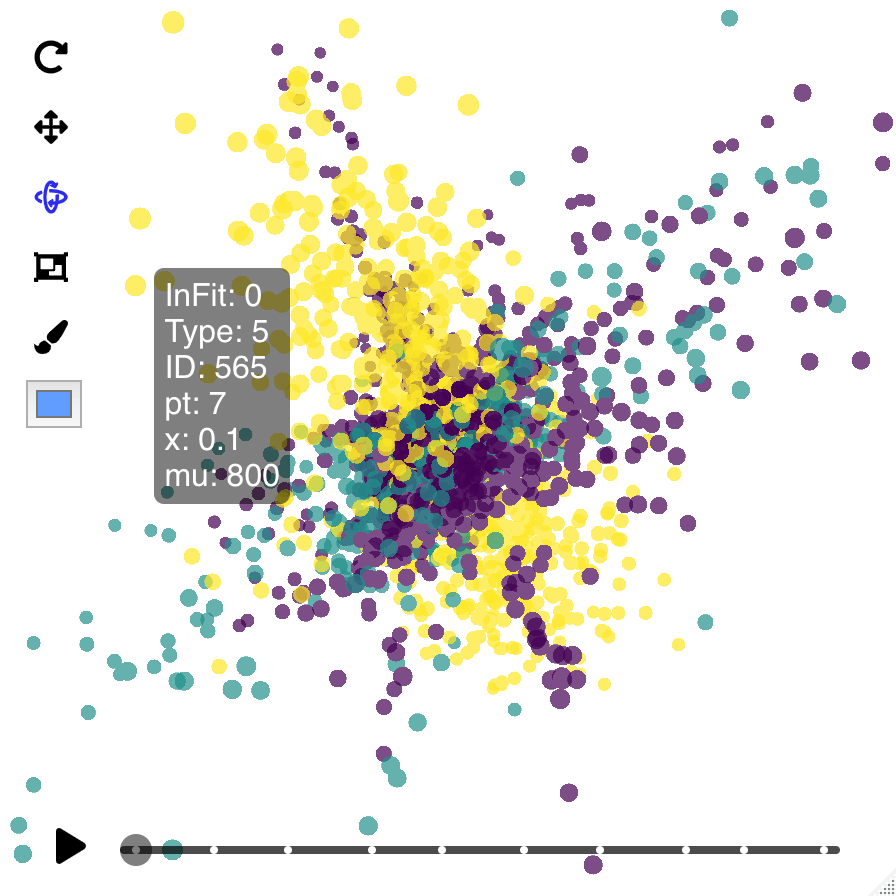
Taking the Scenic Route: Interactive and Performant Tour Animations
The tour provides a useful vehicle for exploring high dimensional datasets. It works by combining a sequence of projections---the tour path---in to an animation---the display method. Current display implementations in R are limited in their interactivity and portability, and give poor performance and jerky animations even for small datasets. We take a detour into web technologies, such as Three.js and WebGL, to support smooth and performant tour visualisations. The R package detourr implements a set of display tools that allow for rich interactions (including orbit controls, scrubbing, and brushing) and smooth animations for large datasets. It provides a declarative R interface which is accessible to new users, and it supports linked views using crosstalk and shiny. The resulting animations are portable across a wide range of browsers and devices. We also extend the radial transformation of the Sage Tour (@laa2021burning) to 3 or more dimensions with an implementation in 3D, and provide a simplified implementation of the Slice Tour (@laa2020slice).
Identifying Counterfactual Queries with the R Package cfid
In the framework of structural causal models, counterfactual queries describe events that concern multiple alternative states of the system under study. Counterfactual queries often take the form of "what if" type questions such as "would an applicant have been hired if they had over 10 years of experience, when in reality they only had 5 years of experience?" Such questions and counterfactual inference in general are crucial, for example when addressing the problem of fairness in decision-making. Because counterfactual events contain contradictory states of the world, it is impossible to conduct a randomized experiment to address them without making several restrictive assumptions. However, it is sometimes possible to identify such queries from observational and experimental data by representing the system under study as a causal model, and the available data as symbolic probability distributions. @shpitser2007 constructed two algorithms, called ID\* and IDC\*, for identifying counterfactual queries and conditional counterfactual queries, respectively. These two algorithms are analogous to the ID and IDC algorithms by @shpitser2006id [@shpitser2006idc] for identification of interventional distributions, which were implemented in R by @tikka2017 in the causaleffect package. We present the R package [cfid](https://CRAN.R-project.org/package=cfid) that implements the ID\* and IDC\* algorithms. Identification of counterfactual queries and the features of cfid are demonstrated via examples.
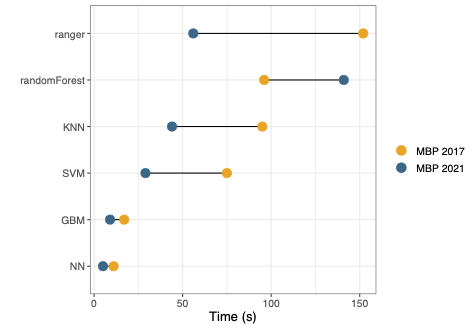
vivid: An R package for Variable Importance and Variable Interactions Displays for Machine Learning Models
We present vivid, an R package for visualizing variable importance and variable interactions in machine learning models. The package provides heatmap and graph-based displays for viewing variable importance and interaction jointly, and partial dependence plots in both a matrix layout and an alternative layout emphasizing important variable subsets. With the intention of increasing machine learning models' interpretability and making the work applicable to a wider readership, we discuss the design choices behind our implementation by focusing on the package structure and providing an in-depth look at the package functions and key features. We also provide a practical illustration of the software in use on a data set.
Generalized Estimating Equations using the new R package glmtoolbox
This paper introduces a very comprehensive implementation, available in the new `R` package `glmtoolbox`, of a very flexible statistical tool known as Generalized Estimating Equations (GEE), which analyzes cluster correlated data utilizing marginal models. As well as providing more built-in structures for the working correlation matrix than other GEE implementations in `R`, this GEE implementation also allows the user to: $(1)$ compute several estimates of the variance-covariance matrix of the estimators of the parameters of interest; $(2)$ compute several criteria to assist the selection of the structure for the working-correlation matrix; $(3)$ compare nested models using the Wald test as well as the generalized score test; $(4)$ assess the goodness-of-fit of the model using Pearson-, deviance- and Mahalanobis-type residuals; $(5)$ perform sensibility analysis using the global influence approach (that is, dfbeta statistic and Cook's distance) as well as the local influence approach; $(6)$ use several criteria to perform variable selection using a hybrid stepwise procedure; $(7)$ fit models with nonlinear predictors; $(8)$ handle dropout-type missing data under MAR rather than MCAR assumption by using observation-specific or cluster-specific weighted methods. The capabilities of this GEE implementation are illustrated by analyzing four real datasets obtained from longitudinal studies.
clustAnalytics: An R Package for Assessing Stability and Significance of Communities in Networks
This paper introduces the R package [clustAnalytics](https://CRAN.R-project.org/package=clustAnalytics), which comprises a set of criteria for assessing the significance and stability of communities in networks found by any clustering algorithm. [clustAnalytics](https://CRAN.R-project.org/package=clustAnalytics) works with graphs of class [igraph](https://CRAN.R-project.org/package=igraph) from the R-package [igraph](https://CRAN.R-project.org/package=igraph), extended to handle weighted and/or directed graphs. [clustAnalytics](https://CRAN.R-project.org/package=clustAnalytics) provides a set of community scoring functions, and methods to systematically compare their values to those of a suitable null model, which are of use when testing for cluster significance. It also provides a non parametric bootstrap method combined with similarity metrics derived from information theory and combinatorics, useful when testing for cluster stability, as well as a method to synthetically generate a weighted network with a ground truth community structure based on the preferential attachment model construction, producing networks with communities and scale-free degree distribution.
markovMSM: An R Package for Checking the Markov Condition in Multi-State Survival Data
Multi-state models can be used to describe processes in which an individual moves through a finite number of states in continuous time. These models allow a detailed view of the evolution or recovery of the process and can be used to study the effect of a vector of explanatory variables on the transition intensities or to obtain prediction probabilities of future events after a given event history. In both cases, before using these models, we have to evaluate whether the Markov assumption is tenable. This paper introduces the [markovMSM](https://CRAN.R-project.org/package=markovMSM) package, a software application for R, which considers tests of the Markov assumption that are applicable to general multi-state models. Three approaches using existing methodology are considered: a simple method based on including covariates depending on the history; methods based on measuring the discrepancy of the non-Markov estimators of the transition probabilities to the Markovian Aalen-Johansen estimators; and, finally, methods that were developed by considering summaries from families of log-rank statistics where individuals are grouped by the state occupied by the process at a particular time point. The main functionalities of the [markovMSM](https://CRAN.R-project.org/package=markovMSM) package are illustrated using real data examples.
A Framework for Producing Small Area Estimates Based on Area-Level Models in R
The R package [emdi](https://CRAN.R-project.org/package=emdi) facilitates the estimation of regionally disaggregated indicators using small area estimation methods and provides tools for model building, diagnostics, presenting, and exporting the results. The package version 1.1.7 includes unit-level small area models that rely on access to micro data. The area-level model by @Fay1979 and various extensions have been added to the package since the release of version 2.0.0. These extensions include (a) area-level models with back-transformations, (b) spatial and robust extensions, (c) adjusted variance estimation methods, and (d) area-level models that account for measurement errors. Corresponding mean squared error estimators are implemented for assessing the uncertainty. User-friendly tools like a stepwise variable selection, model diagnostics, benchmarking options, high quality maps and results exportation options enable a complete analysis procedure. The functionality of the package is illustrated by examples based on synthetic data for Austrian districts.
Onlineforecast: An R Package for Adaptive and Recursive Forecasting
Systems that rely on forecasts to make decisions, e.g. control or energy trading systems, require frequent updates of the forecasts. Usually, the forecasts are updated whenever new observations become available, hence in an online setting. We present the [R]{.sans-serif} package [[onlineforecast](https://onlineforecasting.org)]{.sans-serif} that provides a generalized setup of data and models for online forecasting. It has functionality for time-adaptive fitting of dynamical and non-linear models. The setup is tailored to enable the effective use of forecasts as model inputs, e.g. numerical weather forecast. Users can create new models for their particular applications and run models in an operational setting. The package also allows users to easily replace parts of the setup, e.g. using new methods for estimation. The package comes with comprehensive vignettes and examples of online forecasting applications in energy systems, but can easily be applied for online forecasting in all fields.
Robust Functional Linear Regression Models
With advancements in technology and data storage, the availability of functional data whose sample observations are recorded over a continuum, such as time, wavelength, space grids, and depth, progressively increases in almost all scientific branches. The functional linear regression models, including scalar-on-function and function-on-function, have become popular tools for exploring the functional relationships between the scalar response-functional predictors and functional response-functional predictors, respectively. However, most existing estimation strategies are based on non-robust estimators that are seriously hindered by outlying observations, which are common in applied research. In the case of outliers, the non-robust methods lead to undesirable estimation and prediction results. Using a readily-available [R]{.sans-serif} package robflreg, this paper presents several robust methods build upon the functional principal component analysis for modeling and predicting scalar-on-function and function-on-function regression models in the presence of outliers. The methods are demonstrated via simulated and empirical datasets.

A Hexagon Tile Map Algorithm for Displaying Spatial Data
Spatial distributions have been presented on alternative representations of geography, such as cartograms, for many years. In modern times, interactivity and animation have allowed alternative displays to play a larger role. Alternative representations have been popularised by online news sites, and digital atlases with a focus on public consumption. Applications are increasingly widespread, especially in the areas of disease mapping, and election results. The algorithm presented here creates a display that uses tessellated hexagons to represent a set of spatial polygons, and is implemented in the R package called sugarbag. It allocates these hexagons in a manner that preserves the spatial relationship of the geographic units, in light of their positions to points of interest. The display showcases spatial distributions, by emphasising the small geographical regions that are often difficult to locate on geographic maps.

A Clustering Algorithm to Organize Satellite Hotspot Data for the Purpose of Tracking Bushfires Remotely
This paper proposes a spatiotemporal clustering algorithm and its implementation in the R package spotoroo. This work is motivated by the catastrophic bushfires in Australia throughout the summer of 2019-2020 and made possible by the availability of satellite hotspot data. The algorithm is inspired by two existing spatiotemporal clustering algorithms but makes enhancements to cluster points spatially in conjunction with their movement across consecutive time periods. It also allows for the adjustment of key parameters, if required, for different locations and satellite data sources. Bushfire data from Victoria, Australia, is used to illustrate the algorithm and its use within the package.

asteRisk - Integration and Analysis of Satellite Positional Data in R
Over the past few years, the amount of artificial satellites orbiting Earth has grown fast, with close to a thousand new launches per year. Reliable calculation of the evolution of the satellites' position over time is required in order to efficiently plan the launch and operation of such satellites, as well as to avoid collisions that could lead to considerable losses and generation of harmful space debris. Here, we present asteRisk, the first R package for analysis of the trajectory of satellites. The package provides native implementations of different methods to calculate the orbit of satellites, as well as tools for importing standard file formats typically used to store satellite position data and to convert satellite coordinates between different frames of reference. Such functionalities provide the foundation for integrating orbital data and astrodynamics analysis in R.
gplsim: An R Package for Generalized Partially Linear Single-index Models
Generalized partially linear single-index models (GPLSIMs) are important tools in nonparametric regression. They extend popular generalized linear models to allow flexible nonlinear dependence on some predictors while overcoming the "curse of dimensionality." We develop an R package gplsim that implements efficient spline estimation of GPLSIMs, proposed by [@yu_penalized_2002] and [@yu_penalised_2017], for a response variable from a general exponential family. The package builds upon the popular mgcv package for generalized additive models (GAMs) and provides functions that allow users to fit GPLSIMs with various link functions, select smoothing tuning parameter $\lambda$ against generalized cross-validation or alternative choices, and visualize the estimated unknown univariate function of single-index term. In this paper, we discuss the implementation of gplsim in detail, and illustrate the use case through a sine-bump simulation study with various links and a real-data application to air pollution data.
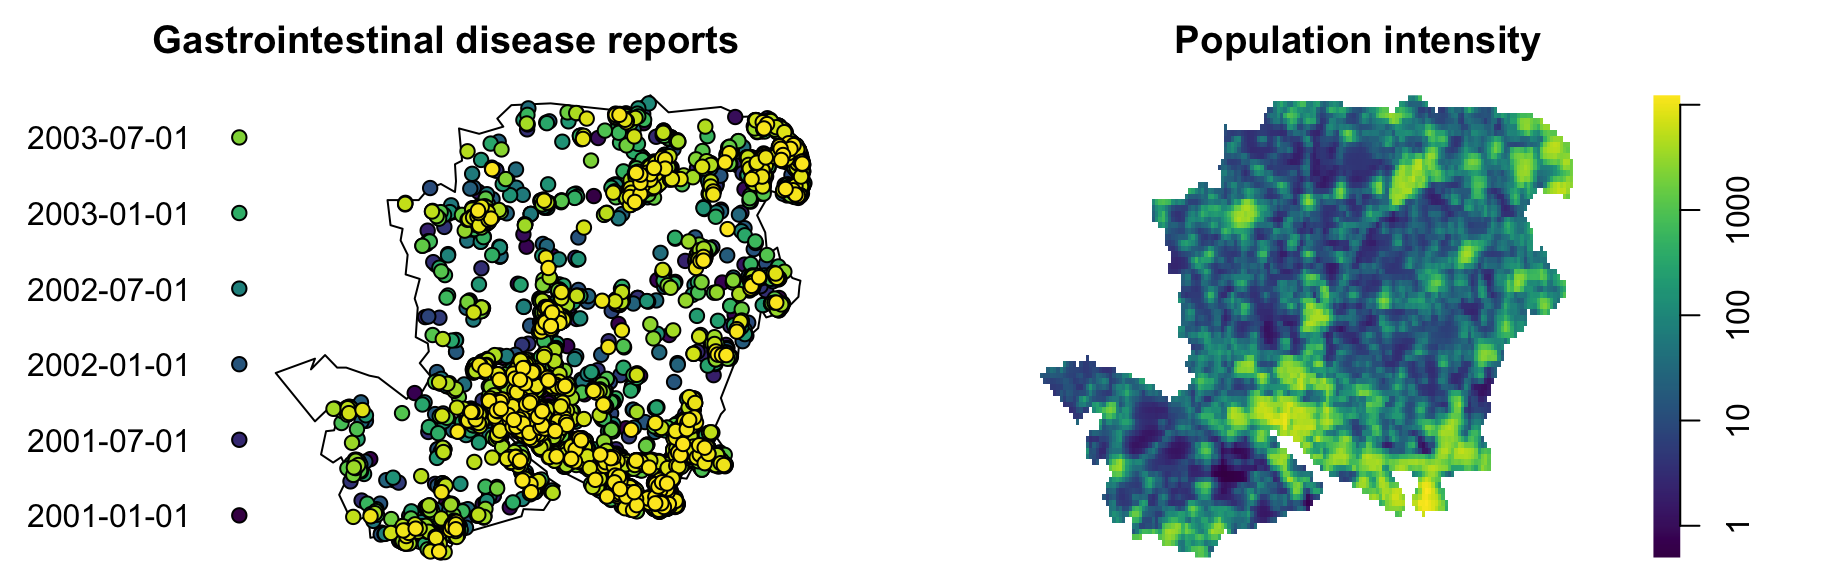
Non-Parametric Analysis of Spatial and Spatio-Temporal Point Patterns
The analysis of spatial and spatio-temporal point patterns is becoming increasingly necessary, given the rapid emergence of geographically and temporally indexed data in a wide range of fields. Non-parametric point pattern methods are a highly adaptable approach to answering questions about the real-world using complex data in the form of collections of points. Several methodological advances have been introduced in the last few years. This paper examines the current methodology, including the most recent developments in estimation and computation, and shows how various R packages can be combined to run a set of non-parametric point pattern analyses in a guided and intuitive way. An example of non-specific gastrointestinal disease reports in Hampshire, UK, from 2001 to 2003 is used to illustrate the methods, procedures and interpretations.

nlmeVPC: Visual Model Diagnosis for the Nonlinear Mixed Effect Model
A nonlinear mixed effects model is useful when the data are repeatedly measured within the same unit or correlated between units. Such models are widely used in medicine, disease mechanics, pharmacology, ecology, social science, psychology, etc. After fitting the nonlinear mixed effect model, model diagnostics are essential for verifying that the results are reliable. The visual predictive check (VPC) has recently been highlighted as a visual diagnostic tool for pharmacometric models. This method can also be applied to general nonlinear mixed effects models. However, functions for VPCs in existing R packages are specialized for pharmacometric model diagnosis, and are not suitable for general nonlinear mixed effect models. In this paper, we propose nlmeVPC, an R package for the visual diagnosis of various nonlinear mixed effect models. The nlmeVPC package allows for more diverse model diagnostics, including visual diagnostic tools that extend the concept of VPCs along with the capabilities of existing R packages.

Likelihood Ratio Test-Based Drug Safety Assessment using R Package pvLRT
Medical product safety continues to be a key concern of the twenty-first century. Several spontaneous adverse events reporting databases established across the world continuously collect and archive adverse events data on various medical products. Determining signals of disproportional reporting (SDR) of product/adverse event pairs from these large-scale databases require the use of principled statistical techniques. Likelihood ratio test (LRT)-based approaches are particularly noteworthy in this context as they permit objective SDR detection without requiring ad hoc thresholds. However, their implementation is non-trivial due to analytical complexities, which necessitate the use of computation-heavy methods. Here we introduce R package pvLRT which implements a suite of LRT approaches, along with various post-processing and graphical summary functions, to facilitate simplified use of the methodologies. Detailed examples are provided to illustrate the package through analyses of three real product safety datasets obtained from publicly available FDA FAERS and VAERS databases.
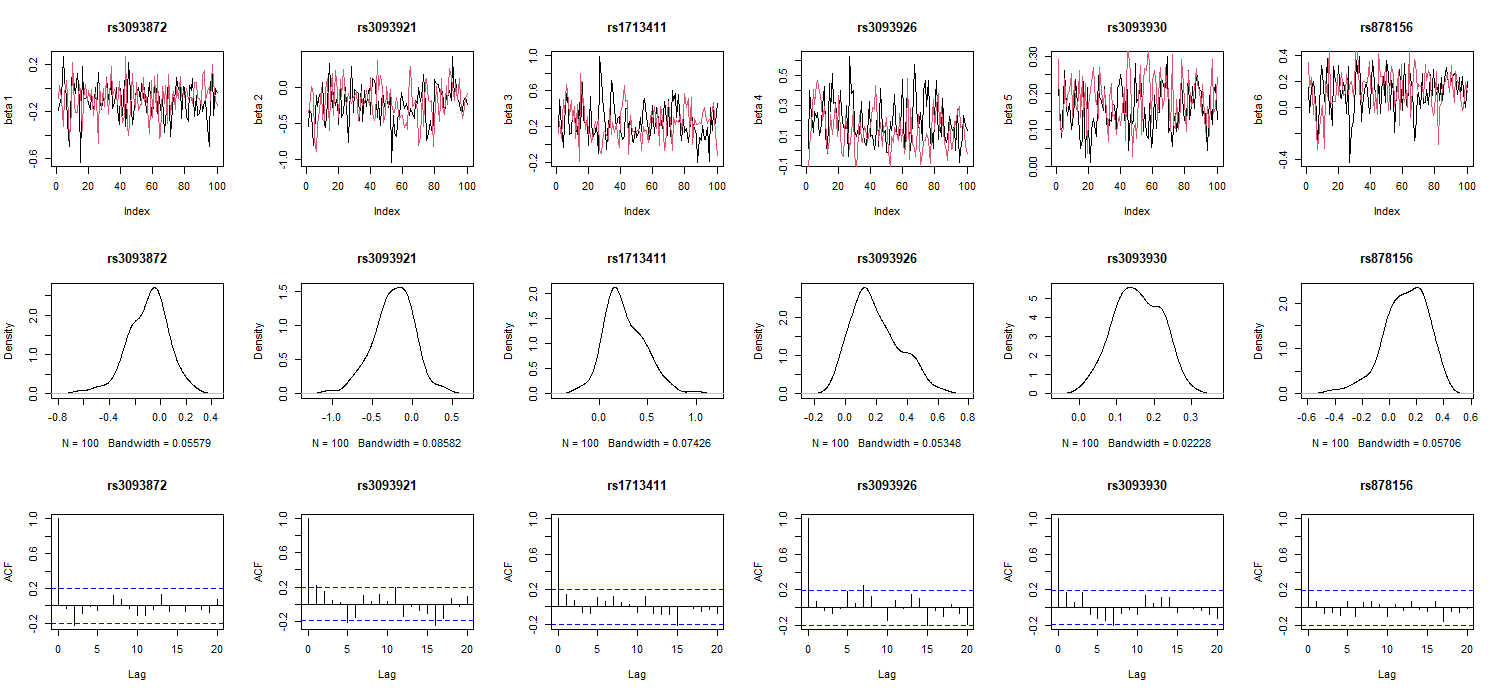
GCPBayes: An R package for studying Cross-Phenotype Genetic Associations with Group-level Bayesian Meta-Analysis
Several R packages have been developed to study cross-phenotypes associations (or pleiotropy) at the SNP-level, based on summary statistics data from genome-wide association studies (GWAS). However, none of them allow for consideration of the underlying group structure of the data. We developed an R package, entitled GCPBayes (Group level Bayesian Meta-Analysis for Studying Cross-Phenotype Genetic Associations), introduced by Baghfalaki et al. (2021), that implements continuous and Dirac spike priors for group selection, and also a Bayesian sparse group selection approach with hierarchical spike and slab priors, to select important variables at the group level and within the groups. The methods use summary statistics data from association studies or individual level data as inputs, and perform Bayesian meta-analysis approaches across multiple phenotypes to detect pleiotropy at both group-level (e.g., at the gene or pathway level) and within group (e.g., at the SNP level).
rankFD: An R Software Package for Nonparametric Analysis of General Factorial Designs
Many experiments can be modeled by a factorial design which allows statistical analysis of main factors and their interactions. A plethora of parametric inference procedures have been developed, for instance based on normality and additivity of the effects. However, often, it is not reasonable to assume a parametric model, or even normality, and effects may not be expressed well in terms of location shifts. In these situations, the use of a fully nonparametric model may be advisable. Nevertheless, until very recently, the straightforward application of nonparametric methods in complex designs has been hampered by the lack of a comprehensive R package. This gap has now been closed by the novel R-package [rankFD](https://CRAN.R-project.org/package=rankFD) that implements current state of the art nonparametric ranking methods for the analysis of factorial designs. In this paper, we describe its use, along with detailed interpretations of the results.
The segmetric Package: Metrics for Assessing Segmentation Accuracy for Geospatial Data
Segmentation methods are a valuable tool for exploring spatial data by identifying objects based on images' features. However, proper segmentation assessment is critical for obtaining high-quality results and running well-tuned segmentation algorithms Usually, various metrics are used to inform different types of errors that dominate the results. We describe a new R package, [segmetric](https://CRAN.R-project.org/package=segmetric), for assessing and analyzing the geospatial segmentation of satellite images. This package unifies code and knowledge spread across different software implementations and research papers to provide a variety of supervised segmentation metrics available in the literature. It also allows users to create their own metrics to evaluate the accuracy of segmented objects based on reference polygons. We hope this package helps to fulfill some of the needs of the R community that works with Earth Observation data.

Fairness Audits and Debiasing Using mlr3fairness
Given an increase in data-driven automated decision-making based on machine learning (ML) models, it is imperative that, along with tools to develop and improve such models, there are sufficient capabilities to analyze and assess models with respect to potential biases. We present the package mlr3fairness, a collection of metrics and methods that allow for the assessment of bias in machine learning models. Our package implements a variety of widely used fairness metrics that can be used to audit models for potential biases, along with a set of visualizations that can help to provide additional insights into such biases. mlr3fairness furthermore integrates bias mitigation methods for machine learning models through data pre-processing or post-processing of predictions. These allow practitioners to trade off performance and fairness metrics that are appropriate for their use case.
ClusROC: An R Package for ROC Analysis in Three-Class Classification Problems for Clustered Data
This paper introduces an R package for ROC analysis in three-class classification problems, for clustered data in the presence of covariates, named ClusROC. The clustered data that we address have some hierarchical structure, i.e., dependent data deriving, for example, from longitudinal studies or repeated measurements. This package implements point and interval covariate-specific estimation of the true class fractions at a fixed pair of thresholds, the ROC surface, the volume under the ROC surface, and the optimal pairs of thresholds. We illustrate the usage of the implemented functions through two practical examples from different fields of research.
Resampling Fuzzy Numbers with Statistical Applications: FuzzyResampling Package
The classical bootstrap has proven its usefulness in many areas of statistical inference. However, some shortcomings of this method are also known. Therefore, various bootstrap modifications and other resampling algorithms have been introduced, especially for real-valued data. Recently, bootstrap methods have become popular in statistical reasoning based on imprecise data often modeled by fuzzy numbers. One of the challenges faced there is to create bootstrap samples of fuzzy numbers which are similar to initial fuzzy samples but different in some way at the same time. These methods are implemented in [FuzzyResampling](https://CRAN.R-project.org/package=FuzzyResampling) package and applied in different statistical functions like single-sample or two-sample tests for the mean. Besides describing the aforementioned functions, some examples of their applications as well as numerical comparisons of the classical bootstrap with the new resampling algorithms are provided in this contribution.
combinIT: An R Package for Combining Interaction Tests for Unreplicated Two-Way Tables
Several new tests have been proposed for testing interaction in unreplicated two-way analysis of variance models. Unfortunately, each test is powerful for detecting a pattern of interaction. Therefore, it is reasonable to combine multiple interaction tests to increase the power of detection for significant interactions. We introduce the package [combinIT](https://CRAN.R-project.org/package=combinIT) that provides researchers the results of six existing recommended interaction tests, including: the value of test statistics, exact Monte Carlo p-values, approximated or adjusted p-values, the results of four combined tests and explanations of interaction types if the discussed tests are significant. The software combinIT is a more comprehensive R package in comparison with the two existing packages. In addition, the software is executed quickly to obtain the exact Monte Carlo p-values, even for large Monte Carlo runs, in contrast to existing packages.
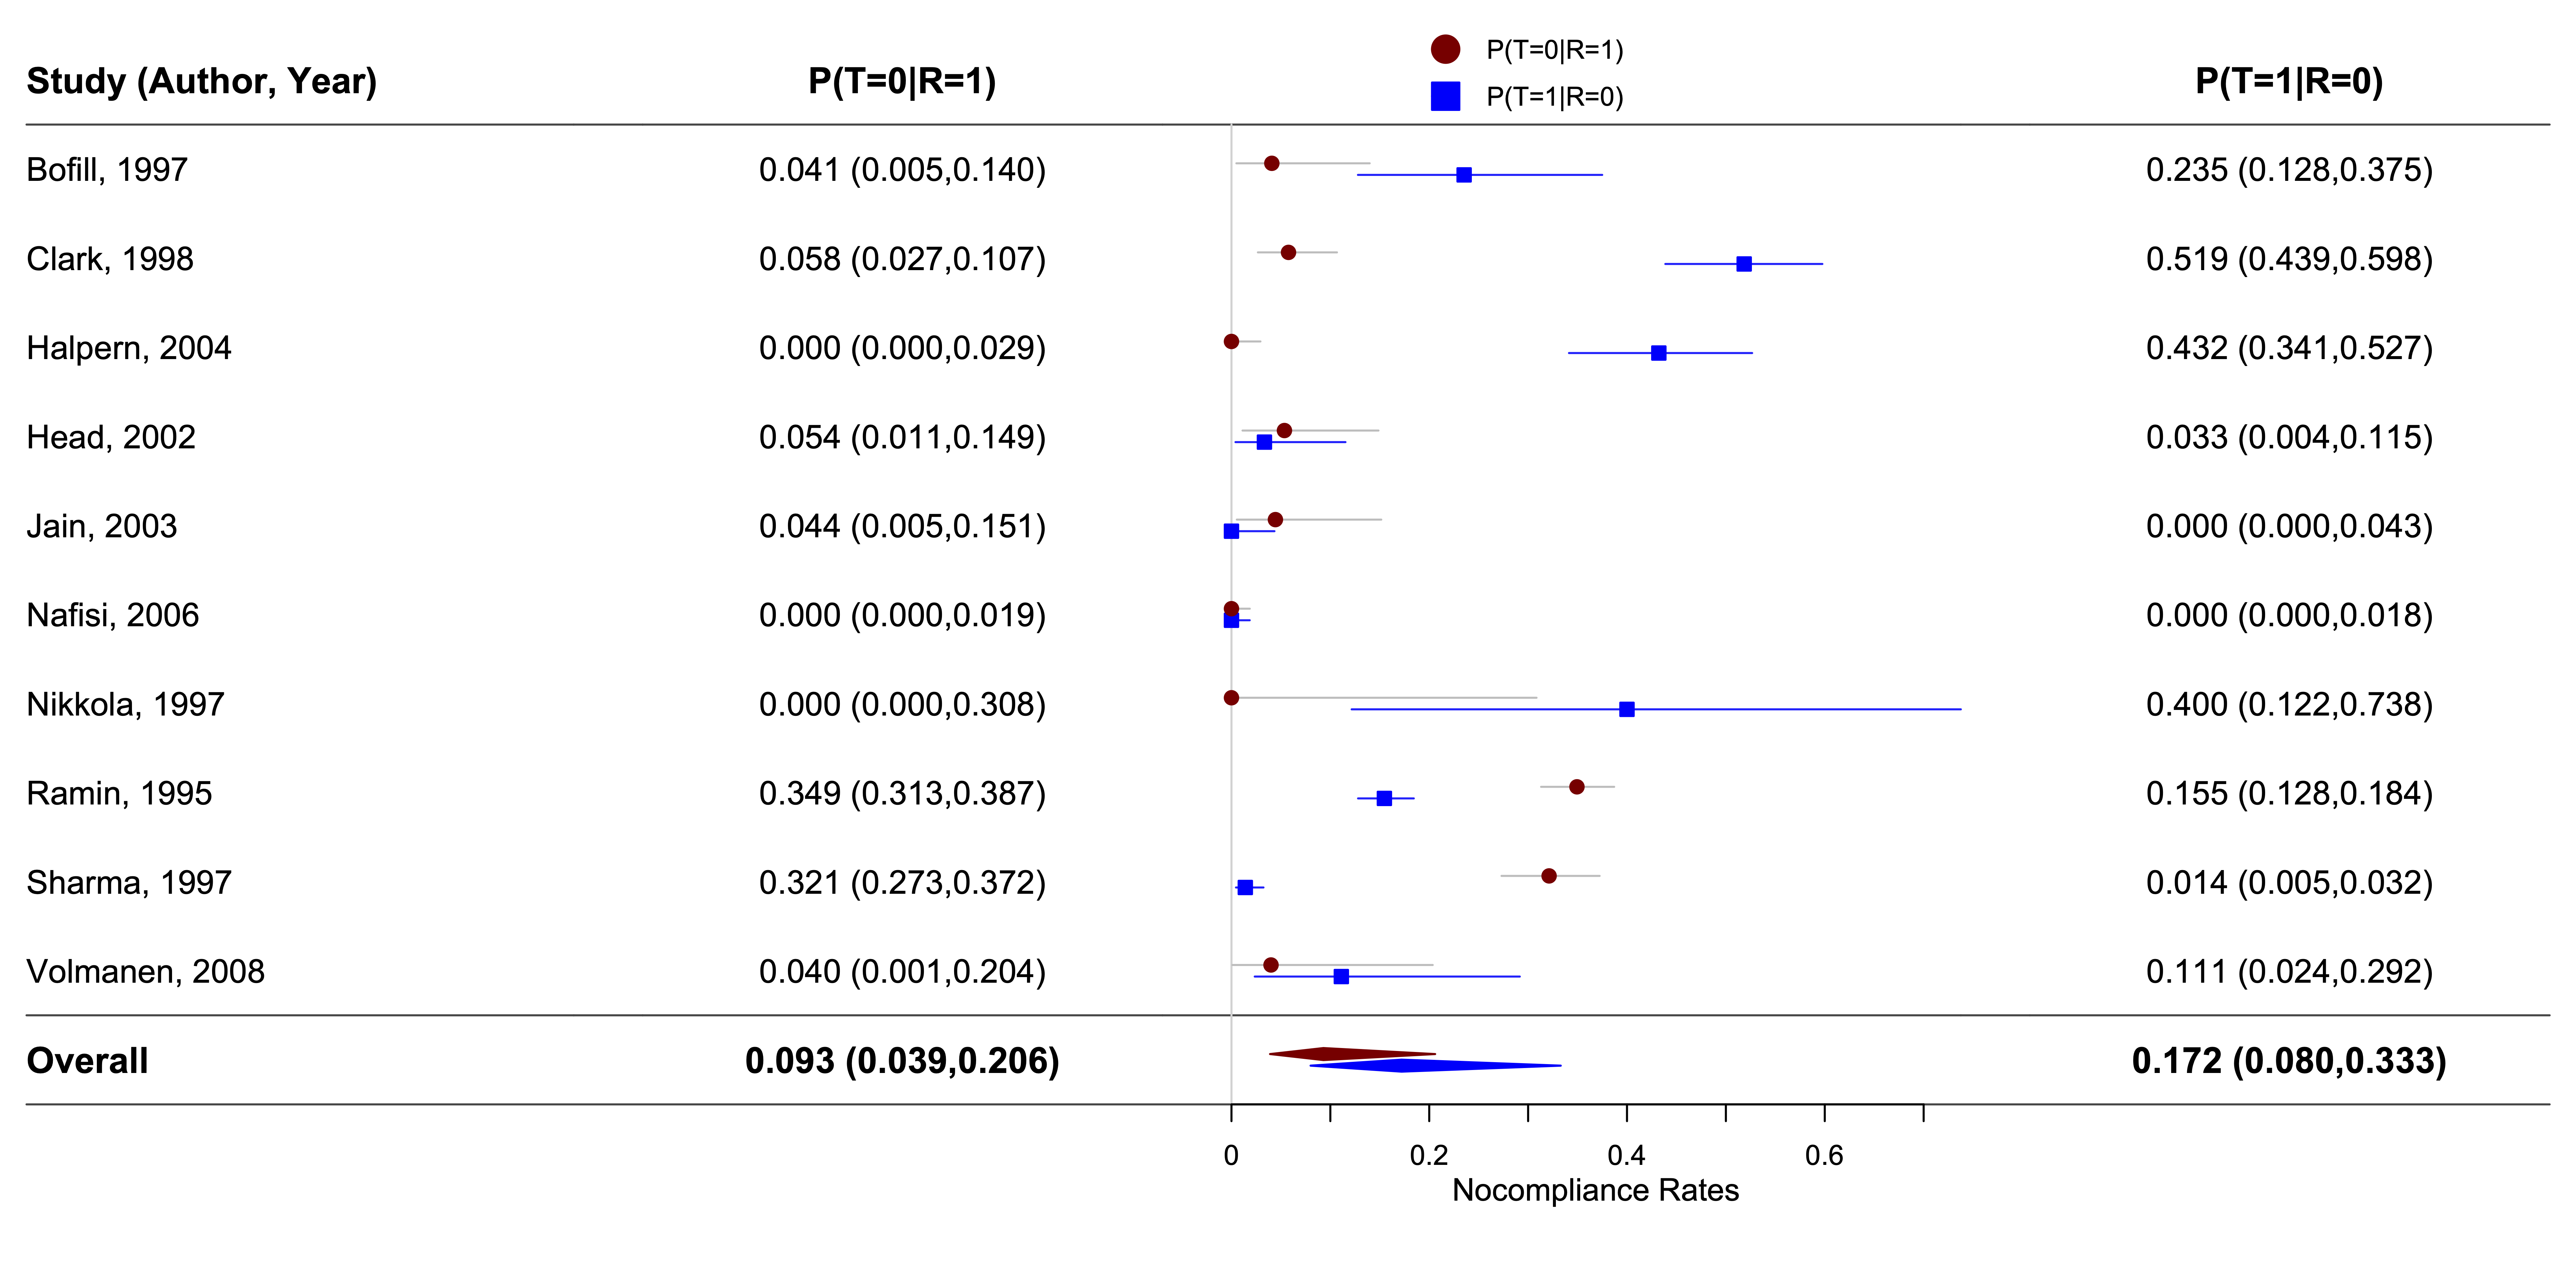
Estimating Causal Effects using Bayesian Methods with the R Package BayesCACE
Noncompliance, a common problem in randomized clinical trials (RCTs), complicates the analysis of the causal treatment effect, especially in meta-analysis of RCTs. The complier average causal effect (CACE) measures the effect of an intervention in the latent subgroup of the population that complies with its assigned treatment (the compliers). Recently, Bayesian hierarchical approaches have been proposed to estimate the CACE in a single RCT and a meta-analysis of RCTs. We develop an R package, BayesCACE, to provide user-friendly functions for implementing CACE analysis for binary outcomes based on the flexible Bayesian hierarchical framework. This package includes functions for analyzing data from a single study and for performing a meta-analysis with either complete or incomplete compliance data. The package also provides various functions for generating forest, trace, posterior density, and auto-correlation plots, which can be useful to review noncompliance rates, visually assess the model, and obtain study-specific and overall CACEs.
robslopes: Efficient Computation of the (Repeated) Median Slope
Modern use of slope estimation often involves the (repeated) estimation of a large number of slopes on a large number of data points. Some of the most popular non-parametric and robust alternatives to the least squares estimator are the Theil-Sen and Siegel's repeated median slope estimators. The [*robslopes*](https://CRAN.R-project.org/package=robslopes) package contains fast algorithms for these slope estimators. The implemented randomized algorithms run in $\mathcal{O}(n\log(n))$ and $\mathcal{O}(n\log^2(n))$ expected time respectively and use $\mathcal{O}(n)$ space. They achieve speedups up to a factor $10^3$ compared with existing implementations for common sample sizes, as illustrated in a benchmark study, and they allow for the possibility of estimating the slopes on samples of size $10^5$ and larger thanks to the limited space usage. Finally, the original algorithms are adjusted in order to properly handle duplicate values in the data set.

Generalized Mosaic Plots in the ggplot2 Framework
Graphical methods for categorical variables are not well developed when compared with visualizations for numeric data. One method available for multidimensional categorical data visualizations is mosaic plots. Mosaic plots are an easy and powerful option for identifying relationships between multiple categorical variables. Although various packages have implemented mosaic plots, no implementation within the grammar of graphics supports mosaic plots. We present a new implementation of mosaic plots in R, ggmosaic, that implements a custom ggplot2 geom designed for generalized mosaic plots. Equipped with the functionality and flexibility of ggplot2, ggmosaic introduces new features not previously available for mosaic plots, including a novel method of incorporating a rendering of the underlying density via jittering. This paper provides an overview of the implementation and examples that highlight the versatility and ease of use of ggmosaic while demonstrating the practicality of mosaic plots.
The openVA Toolkit for Verbal Autopsies
Verbal autopsy (VA) is a survey-based tool widely used to infer cause of death (COD) in regions without complete-coverage civil registration and vital statistics systems. In such settings, many deaths happen outside of medical facilities and are not officially documented by a medical professional. VA surveys, consisting of signs and symptoms reported by a person close to the decedent, are used to infer the COD for an individual, and to estimate and monitor the COD distribution in the population. Several classification algorithms have been developed and widely used to assign causes of death using VA data. However, the incompatibility between different idiosyncratic model implementations and required data structure makes it difficult to systematically apply and compare different methods. The openVA package provides the first standardized framework for analyzing VA data that is compatible with all openly available methods and data structure. It provides an open-source, R implementation of several most widely used VA methods. It supports different data input and output formats, and customizable information about the associations between causes and symptoms. The paper discusses the relevant algorithms, their implementations in R packages under the openVA suite, and demonstrates the pipeline of model fitting, summary, comparison, and visualization in the R environment.
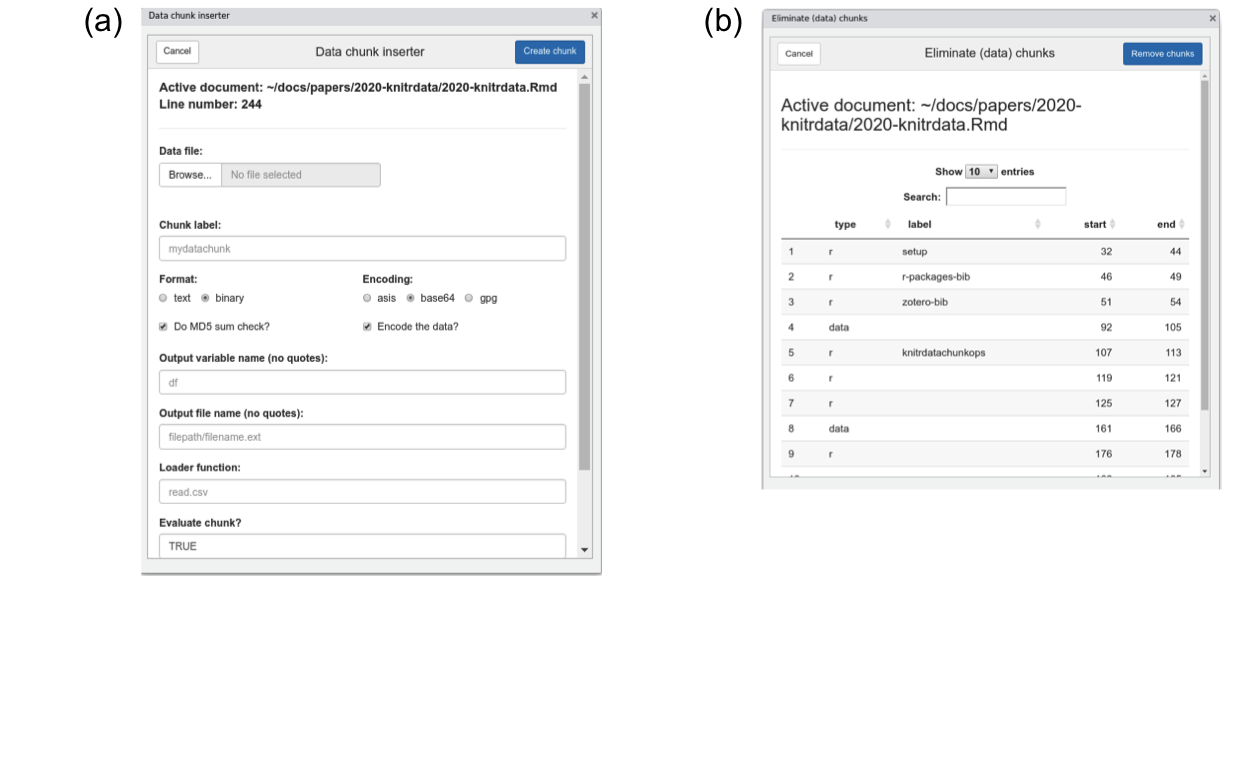
knitrdata: A Tool for Creating Standalone Rmarkdown Source Documents
Though Rmarkdown is a powerful tool for integrating text with code for analyses in a single source document exportable to a variety of output formats, until now there has been no simple way to integrate the data behind analyses into Rmarkdown source documents. The `knitrdata` package makes it possible for arbitrary text and binary data to be integrated directly into Rmarkdown source documents via implementation of a new `data` chunk type. The package includes command-line and graphical tools that facilitate creating and inserting `data` chunks into Rmarkdown documents, and the treatment of `data` chunks is highly configurable via chunk options. These tools allow one to easily create fully standalone Rmarkdown source documents integrating data, ancillary formatting files, analysis code and text in a single file. Used properly, the package can facilitate open distribution of source documents that demonstrate computational reproducibility of scientific results.
DGLMExtPois: Advances in Dealing with Over and Under-dispersion in a Double GLM Framework
In recent years the use of regression models for under-dispersed count data, such as COM-Poisson or hyper-Poisson models, has increased. In this paper the *DGLMExtPois* package is presented. *DGLMExtPois* includes a new procedure to estimate the coefficients of a hyper-Poisson regression model within a GLM framework. The estimation process uses a gradient-based algorithm to solve a nonlinear constrained optimization problem. The package also provides an implementation of the COM-Poisson model, proposed by @huang, to make it easy to compare both models. The functionality of the package is illustrated by fitting a model to a real dataset. Furthermore, an experimental comparison is made with other related packages, although none of these packages allow you to fit a hyper-Poisson model.
Making Provenance Work for You
To be useful, scientific results must be reproducible and trustworthy. Data provenance---the history of data and how it was computed---underlies reproducibility of, and trust in, data analyses. Our work focuses on collecting data provenance from R scripts and providing tools that use the provenance to increase the reproducibility of and trust in analyses done in R. Specifically, our "End-to-end provenance tools" ("E2ETools") use data provenance to: document the computing environment and inputs and outputs of a script's execution; support script debugging and exploration; and explain differences in behavior across repeated executions of the same script. Use of these tools can help both the original author and later users of a script reproduce and trust its results.
remap: Regionalized Models with Spatially Smooth Predictions
Traditional spatial modeling approaches assume that data are second-order stationary, which is rarely true over large geographical areas. A simple way to model nonstationary data is to partition the space and build models for each region in the partition. This has the side effect of creating discontinuities in the prediction surface at region borders. The regional border smoothing approach ensures continuous predictions by using a weighted average of predictions from regional models. The R package *remap* is an implementation of regional border smoothing that builds a collection of spatial models. Special consideration is given to distance calculations that make *remap* package scalable to large problems. Using the *remap* package, as opposed to global spatial models, results in improved prediction accuracy on test data. These accuracy improvements, coupled with their computational feasibility, illustrate the efficacy of the *remap* approach to modeling nonstationary data.
HostSwitch: An R Package to Simulate the Extent of Host-Switching by a Consumer
In biology a general definition for host switch is when an organism (consumer) uses a new host (which represents a resource). The host switch process by a consumer may happen through its pre-existing capability to use a sub-optimal resource. The [*HostSwitch*](https://CRAN.R-project.org/package=HostSwitch) R package provides functions to simulate the dynamics of host switching (extent and frequency) in the population of a consumer that interacts with current and potential hosts over the generations. The [*HostSwitch*](https://CRAN.R-project.org/package=HostSwitch) package is based on a Individual-Based mock-up model published in FORTRAN by @araujo_understanding_2015. The package largely improve the previous mock-up model, by implementing numerous new functionalities such as comparison and evaluation of simulations with several customizable parameters to accommodate several types of biological consumer-host associations, an interactive visualization of the model, an in-depth description of the parameters in a biological context. Finally, we provided three real world scenarios taken from the literature selected from ecology, agriculture and parasitology. This package is intended to reach researchers in the broad field of biology interested in simulating the process of host switch of different types of symbiotic biological associations.
OTrecod: An R Package for Data Fusion using Optimal Transportation Theory
The advances of information technologies often confront users with a large amount of data which is essential to integrate easily. In this context, creating a single database from multiple separate data sources can appear as an attractive but complex issue when same information of interest is stored in at least two distinct encodings. In this situation, merging the data sources consists in finding a common recoding scale to fill the incomplete information in a synthetic database. The OTrecod package provides R-users two functions dedicated to solve this recoding problem using optimal transportation theory. Specific arguments of these functions enrich the algorithms by relaxing distributional constraints or adding a regularization term to make the data fusion more flexible. The OTrecod package also provides a set of support functions dedicated to the harmonization of separate data sources, the handling of incomplete information and the selection of matching variables. This paper gives all the keys to quickly understand and master the original algorithms implemented in the OTrecod package, assisting step by step the user in its data fusion project.
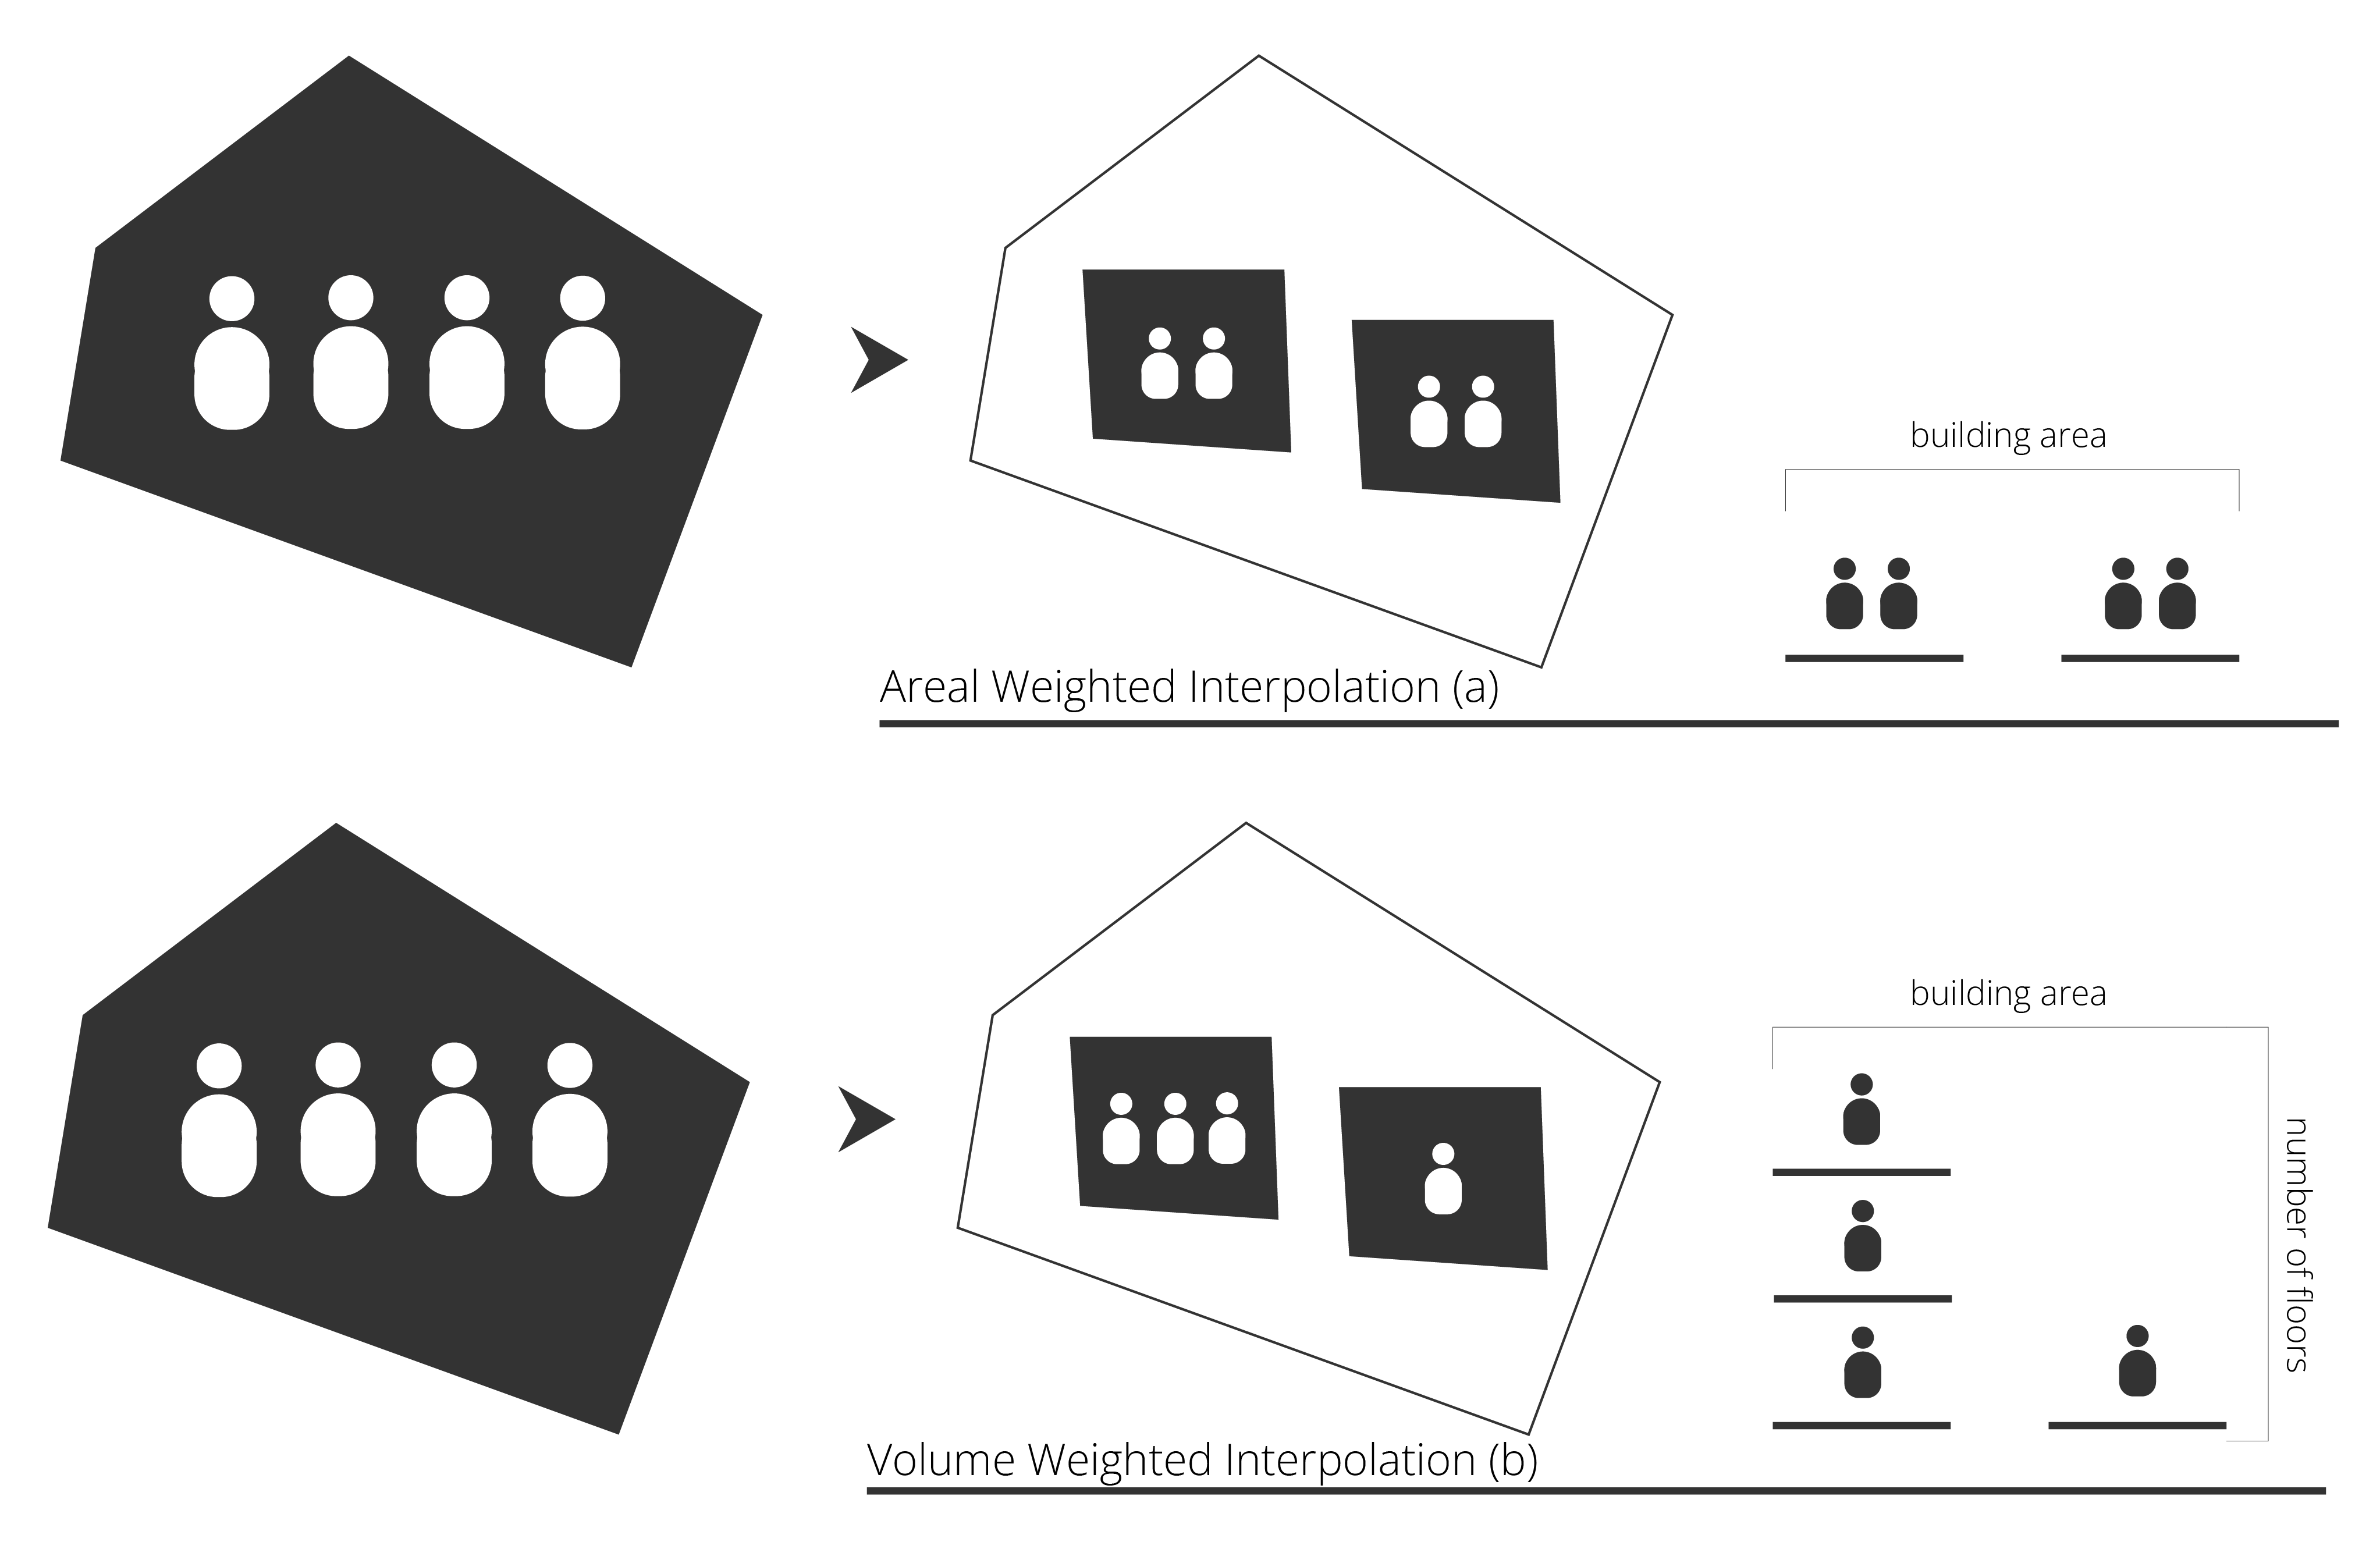
populR: a Package for Population Downscaling in R
Population data provision is usually framed by regulations and restrictions and hence spatially aggregated in predefined enumeration units such as city blocks and census tracts. Many applications require population data at finer scale, and therefore, one may use downscaling methods to transform population counts from coarse spatial units into smaller ones. Although numerous methods for downscaling of population data have been reported in the scientific literature, only a limited number of implementation tools exist. In this study, we introduce populR, an R package that responds to this need. populR provides two downscaling methods, namely Areal Weighted Interpolation and Volume Weighted Interpolation, which are illustrated and compared to alternative implementations in the sf and areal packages using a case study from Mytilini, Greece. The results provide evidence that the vwi approach outperforms the others, and thus, we believe R users may gain significant advantage by using populR for population downscaling.
dycdtools: an R Package for Assisting Calibration and Visualising Outputs of an Aquatic Ecosystem Model
The high complexity of aquatic ecosystem models (AEMs) necessitates a large number of parameters that need calibration, and visualisation of their multifaceted and multi-layered simulation results is necessary for effective communication. Here we present an R package "dycdtools" that contains calibration and post-processing tools for a widely applied aquatic ecosystem model (DYRESM-CAEDYM). The calibration assistant function within the package automatically tests a large number of combinations of parameter values and returns corresponding values for goodness-of-fit, allowing users to narrow parameter ranges or optimise parameter values. The post-processing functions enable users to visualise modelling outputs in four ways: as contours, profiles, time series, and scatterplots. The "dycdtools" package is the first open-source calibration and post-processing tool for DYRESM-CAEDYM, and can also be adjusted for other AEMs with a similar structure. This package is useful to reduce the calibration burden for users and to effectively communicate model results with a broader community.
SurvMetrics: An R package for Predictive Evaluation Metrics in Survival Analysis
Recently, survival models have found vast applications in biostatistics, bioinformatics, reliability engineering, finance and related fields. But there are few R packages focusing on evaluating the predictive power of survival models. This lack of handy software on evaluating survival predictions hinders further applications of survival analysis for practitioners. In this research, we want to fill this gap by providing an \"all-in-one\" R package which implements most predictive evaluation metrics in survival analysis. In the proposed *SurvMetrics* R package, we implement concordance index for both untied and tied survival data; we give a new calculation process of Brier score and integrated Brier score; we also extend the applicability of integrated absolute error and integrated square error for real data. For models that can output survival time predictions, a simplified metric called mean absolute error is also implemented. In addition, we test the effectiveness of all these metrics on simulated and real survival data sets. The newly developed *SurvMetrics* R package is available on CRAN at <https://CRAN.R-project.org/package=SurvMetrics> and GitHub at <https://github.com/skyee1/SurvMetrics>.
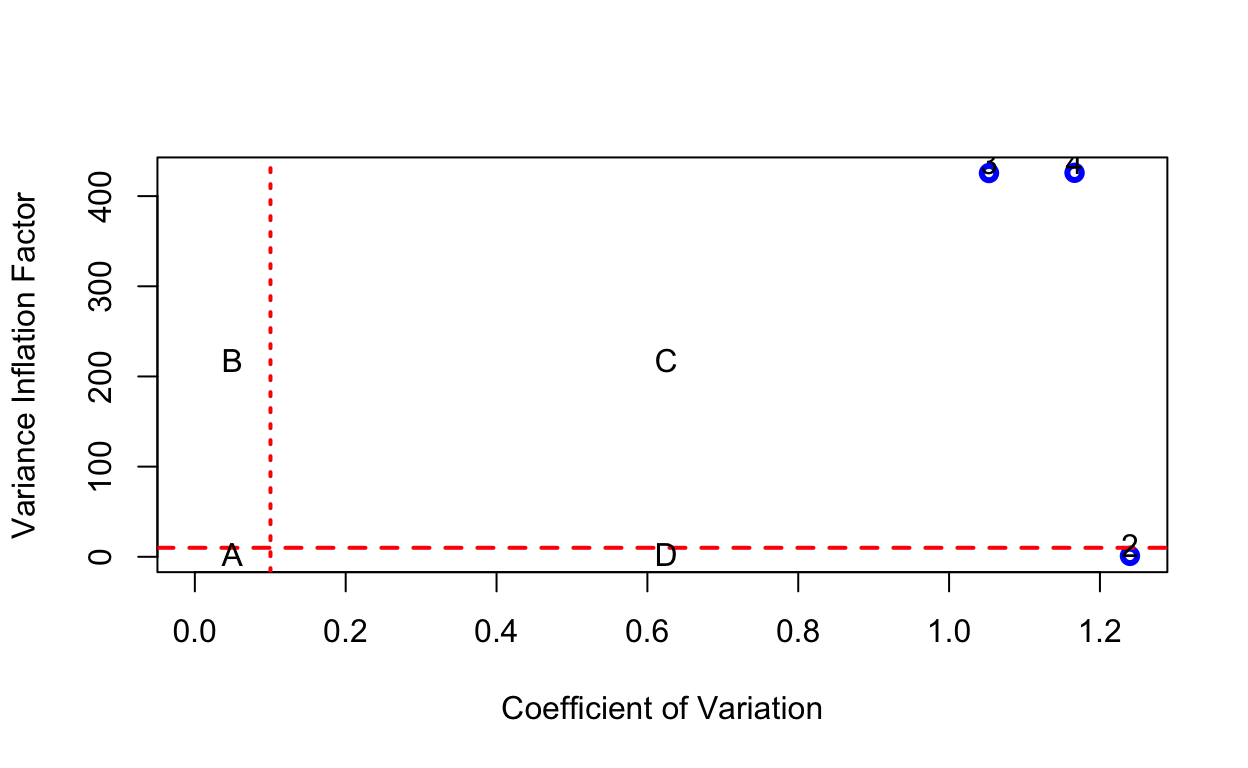
Limitations in Detecting Multicollinearity due to Scaling Issues in the mcvis Package
Transformation of the observed data is a very common practice when a troubling degree of near multicollinearity is detected in a linear regression model. However, it is important to take into account that these transformations may affect the detection of this problem, so they should not be performed systematically. In this paper we analyze the transformation of the data when applying the R package mcvis, showing that it only detects essential near multicollinearity when the *studentise* transformation is performed.
netgwas: An R Package for Network-Based Genome Wide Association Studies
Graphical models are a powerful tool in modelling and analysing complex biological associations in high-dimensional data. The R-package *netgwas* implements the recent methodological development on copula graphical models to (i) construct linkage maps, (ii) infer linkage disequilibrium networks from genotype data, and (iii) detect high-dimensional genotype-phenotype networks. The *netgwas* learns the structure of networks from ordinal data and mixed ordinal-and-continuous data. Here, we apply the functionality in *netgwas* to various multivariate example datasets taken from the literature to demonstrate the kind of insight that can be obtained from the package. We show that our package offers a more realistic association analysis than the classical approaches, as it discriminates between direct and induced correlations by adjusting for the effect of all other variables while performing pairwise associations. This feature controls for spurious interactions between variables that can arise from conventional approaches in a biological sense. The *netgwas* package uses a parallelization strategy on multi-core processors to speed-up computations.

A Study in Reproducibility: The Congruent Matching Cells Algorithm and cmcR Package
Scientific research is driven by our ability to use methods, procedures, and materials from previous studies and further research by adding to it. As the need for computationally-intensive methods to analyze large amounts of data grows, the criteria needed to achieve reproducibility, specifically computational reproducibility, have become more sophisticated. In general, prosaic descriptions of algorithms are not detailed or precise enough to ensure complete reproducibility of a method. Results may be sensitive to conditions not commonly specified in written-word descriptions such as implicit parameter settings or the programming language used. To achieve true computational reproducibility, it is necessary to provide all intermediate data and code used to produce published results. In this paper, we consider a class of algorithms developed to perform firearm evidence identification on cartridge case evidence known as the *Congruent Matching Cells* (CMC) methods. To date, these algorithms have been published as textual descriptions only. We introduce the first open-source implementation of the Congruent Matching Cells methods in the R package cmcR. We have structured the cmcR package as a set of sequential, modularized functions intended to ease the process of parameter experimentation. We use cmcR and a novel variance ratio statistic to explore the CMC methodology and demonstrate how to fill in the gaps when provided with computationally ambiguous descriptions of algorithms.
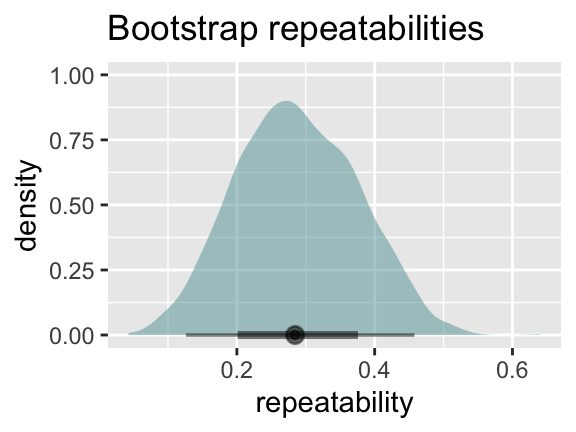
Bootstrapping Clustered Data in R using lmeresampler
Linear mixed-effects models are commonly used to analyze clustered data structures. There are numerous packages to fit these models in R and conduct likelihood-based inference. The implementation of resampling-based procedures for inference are more limited. In this paper, we introduce the lmeresampler package for bootstrapping nested linear mixed-effects models fit via lme4 or nlme. Bootstrap estimation allows for bias correction, adjusted standard errors and confidence intervals for small samples sizes and when distributional assumptions break down. We will also illustrate how bootstrap resampling can be used to diagnose this model class. In addition, lmeresampler makes it easy to construct interval estimates of functions of model parameters.
BayesPPD: An R Package for Bayesian Sample Size Determination Using the Power and Normalized Power Prior for Generalized Linear Models
The R package *BayesPPD* (Bayesian Power Prior Design) supports Bayesian power and type I error calculation and model fitting after incorporating historical data with the power prior and the normalized power prior for generalized linear models (GLM). The package accommodates summary level data or subject level data with covariate information. It supports use of multiple historical datasets as well as design without historical data. Supported distributions for responses include normal, binary (Bernoulli/binomial), Poisson and exponential. The power parameter can be fixed or modeled as random using a normalized power prior for each of these distributions. In addition, the package supports the use of arbitrary sampling priors for computing Bayesian power and type I error rates. In addition to describing the statistical methodology and functions implemented in the package to enable sample size determination (SSD), we also demonstrate the use of *BayesPPD* in two comprehensive case studies.
ppseq: An R Package for Sequential Predictive Probability Monitoring
Advances in drug discovery have produced numerous biomarker-guided therapeutic strategies for treating cancer. Yet the promise of precision medicine comes with the cost of increased complexity. Recent trials of targeted treatments have included expansion cohorts with sample sizes far exceeding those in traditional early phase trials of chemotherapeutic agents. The enlarged sample sizes raise ethical concerns for patients who enroll in clinical trials, and emphasize the need for rigorous statistical designs to ensure that trials can stop early for futility while maintaining traditional control of type I error and power. The R package ppseq provides a framework for designing early phase clinical trials of binary endpoints using sequential futility monitoring based on Bayesian predictive probability. Trial designs can be compared using interactive plots and selected based on measures of efficiency or accuracy.
pCODE: Estimating Parameters of ODE Models
The ordinary differential equation (ODE) models are prominent to characterize the mechanism of dynamical systems with various applications in biology, engineering, and many other areas. While the form of ODE models is often proposed based on the understanding or assumption of the dynamical systems, the values of ODE model parameters are often unknown. Hence, it is of great interest to estimate the ODE parameters once the observations of dynamic systems become available. The parameter cascade method initially proposed by [@parcascade] is shown to provide an accurate estimation of ODE parameters from the noisy observations at a low computational cost. This method is further promoted with the implementation in the R package *CollocInfer* by [@CollocInfer]. However, one bottleneck in using *CollocInfer* to implement the parameter cascade method is the tedious derivations and coding of the Jacobian and Hessian matrices required by the objective functions for doing estimation. We develop an R package *pCODE* to implement the parameter cascade method, which has the advantage that the users are not required to provide any Jacobian or Hessian matrices. Functions in the *pCODE* package accommodate users for estimating ODE parameters along with their variances and tuning the smoothing parameters. The package is demonstrated and assessed with four simulation examples with various settings. We show that *pCODE* offers a derivative-free procedure to estimate any ODE models where its functions are easy to understand and apply. Furthermore, the package has an online Shiny app at <https://pcode.shinyapps.io/pcode/>.

TreeSearch: Morphological Phylogenetic Analysis in R
TreeSearch is an R package for phylogenetic analysis, optimized for discrete character data. Tree search may be conducted using equal or implied step weights with an explicit (albeit inexact) allowance for inapplicable character entries, avoiding some of the pitfalls inherent in standard parsimony methods. Profile parsimony and user-specified optimality criteria are supported. A graphical interface, which requires no familiarity with R, is designed to help a user to improve the quality of datasets through critical review of underpinning character codings; and to obtain additional information from results by identifying and summarizing clusters of similar trees, mapping the distribution of trees, and removing 'rogue' taxa that obscure underlying relationships. Taken together, the package aims to support methodological rigour at each step of data collection, analysis, and the exploration of phylogenetic results.
WLinfer: Statistical Inference for Weighted Lindley Distribution
New distributions are still being suggested for better fitting of a distribution to data, as it is one of the most fundamental problems in terms of the parametric approach. One of such is weighted Lindley (WL) distribution [@ghitany:2011]. Even though WL distribution has become increasingly popular as a possible alternative to traditional distributions such as gamma and log normal distributions, fitting it to data has rarely been addressed in existing R packages. This is the reason we present the [*WLinfer*](https://CRAN.R-project.org/package=WLinfer) package that implements overall statistical inference for WL distribution. In particular, *WLinfer* enables one to conduct the goodness of fit test, point estimation, bias correction, interval estimation, and the likelihood ratio test simply with the `WL` function which is at the core of this package. To assist users who are unfamiliar with WL distribution, we present a brief review followed by an illustrative example with R codes.
Log Likelihood Ratios for Common Statistical Tests Using the likelihoodR Package
The **likelihoodR** package has been developed to allow users to obtain statistics according to the likelihood approach to statistical inference. Commonly used tests are available in the package, such as: *t* tests, ANOVA, correlation, regression and a range of categorical analyses. In addition, there is a sample size calculator for *t* tests, based upon the concepts of strength of evidence, and the probabilities of misleading and weak evidence.
ICAOD: An R Package for Finding Optimal designs for Nonlinear Statistical Models by Imperialist Competitive Algorithm
Optimal design ideas are increasingly used in different disciplines to rein in experimental costs. Given a nonlinear statistical model and a design criterion, optimal designs determine the number of experimental points to observe the responses, the design points and the number of replications at each design point. Currently, there are very few free and effective computing tools for finding different types of optimal designs for a general nonlinear model, especially when the criterion is not differentiable. We introduce an R package [*ICAOD*](https://CRAN.R-project.org/package=ICAOD) to find various types of optimal designs and they include locally, minimax and Bayesian optimal designs for different nonlinear statistical models. Our main computational tool is a novel metaheuristic algorithm called imperialist competitive algorithm (ICA) and inspired by socio-political behavior of humans and colonialism. We demonstrate its capability and effectiveness using several applications. The package also includes several theory-based tools to assess optimality of a generated design when the criterion is a convex function of the design.
dbcsp: User-friendly R package for Distance-Based Common Spatial Patterns
Common Spatial Patterns (CSP) is a widely used method to analyse electroencephalography (EEG) data, concerning the supervised classification of the activity of brain. More generally, it can be useful to distinguish between multivariate signals recorded during a time span for two different classes. CSP is based on the simultaneous diagonalization of the average covariance matrices of signals from both classes and it allows the data to be projected into a low-dimensional subspace. Once the data are represented in a low-dimensional subspace, a classification step must be carried out. The original CSP method is based on the Euclidean distance between signals, and here we extend it so that it can be applied on any appropriate distance for data at hand. Both the classical CSP and the new Distance-Based CSP (DB-CSP) are implemented in an R package, called *dbcsp*.
The R Package HDSpatialScan for the Detection of Clusters of Multivariate and Functional Data using Spatial Scan Statistics
This paper introduces the R package [*HDSpatialScan*](https://CRAN.R-project.org/package=HDSpatialScan). This package allows users to easily apply spatial scan statistics to real-valued multivariate data or both univariate and multivariate functional data. It also permits plotting the detected clusters and to summarize them. In this article the methods are presented and the use of the package is illustrated through examples on environmental data provided in the package.
HDiR: An R Package for Computation and Nonparametric Plug-in Estimation of Directional Highest Density Regions and General Level Sets
A deeper understanding of a distribution support, being able to determine regions of a certain (possibly high) probability content is an important task in several research fields. Package *HDiR* for R is designed for exact computation of directional (circular and spherical) highest density regions and density level sets when the density is fully known. Otherwise, *HDiR* implements nonparametric plug-in methods based on different kernel density estimates for reconstructing this kind of sets. Additionally, it also allows the computation and plug-in estimation of level sets for general functions (not necessarily a density). Some exploratory tools, such as suitably adapted distances and scatterplots, are also implemented. Two original datasets and spherical density models are used for illustrating *HDiR* functionalities.
metapack: An R Package for Bayesian Meta-Analysis and Network Meta-Analysis with a Unified Formula Interface
Meta-analysis, a statistical procedure that compares, combines, and synthesizes research findings from multiple studies in a principled manner, has become popular in a variety of fields. Meta-analyses using study-level (or equivalently *aggregate*) data are of particular interest due to data availability and modeling flexibility. In this paper, we describe an R package *metapack* that introduces a unified formula interface for both meta-analysis and network meta-analysis. The user interface---and therefore the package---allows flexible variance-covariance modeling for multivariate meta-analysis models and univariate network meta-analysis models. Complicated computing for these models has prevented their widespread adoption. The package also provides functions to generate relevant plots and perform statistical inferences like model assessments. Use cases are demonstrated using two real data sets contained in *metapack*.
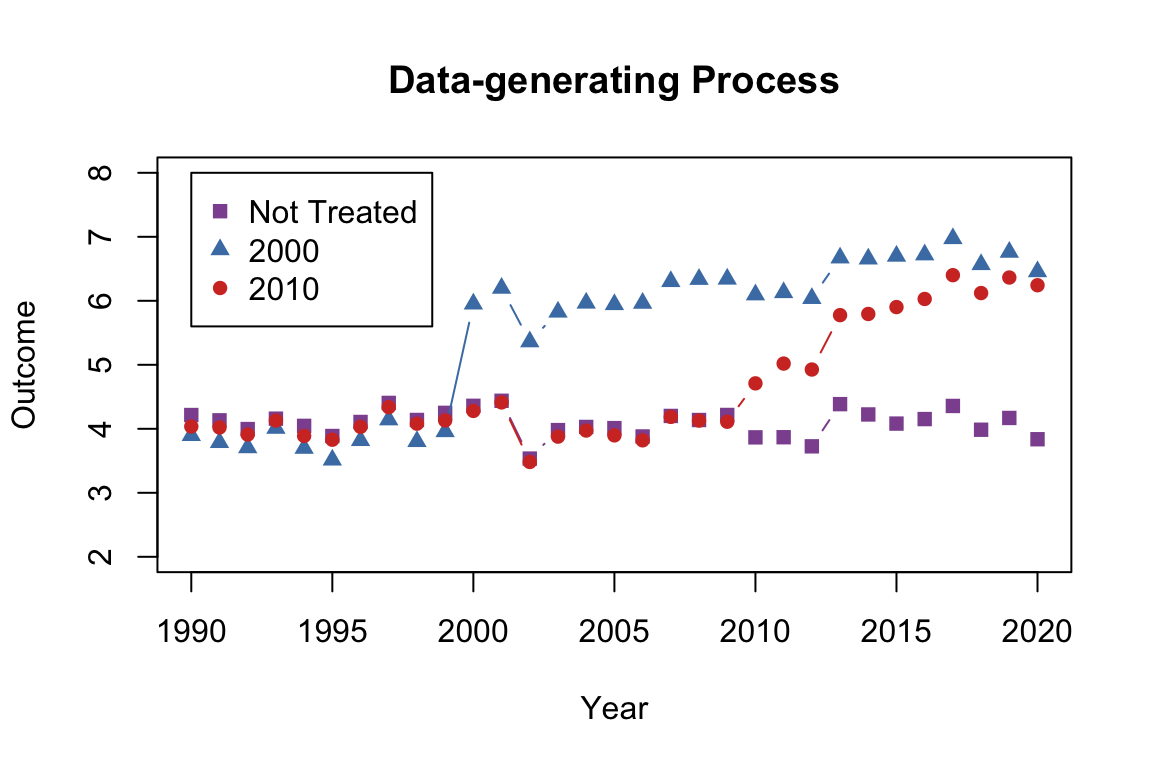
did2s: Two-Stage Difference-in-Differences
Recent work has highlighted the difficulties of estimating difference-in-differences models when the treatment is adopted at different times for different units. This article introduces the R package did2s which implements the estimator introduced in @Gardner_2021. The article provides an approachable review of the underlying econometric theory and introduces the syntax for the function `did2s`. Further, the package introduces functions, event_study and plot_event_study, which uses a common syntax to implement all of the modern event-study estimators.
rbw: An R Package for Constructing Residual Balancing Weights
We describe the R package [*rbw*](https://CRAN.R-project.org/package=rbw), which implements the method of residual balancing weights (RBW) for estimating marginal structural models. In contrast to other methods such as inverse probability weighting (IPW) and covariate balancing propensity scores (CBPS), RBW involves modeling the conditional means of post-treatment confounders instead of the conditional distributions of the treatment to construct the weights. RBW is thus easier to use with continuous treatments, and the method is less susceptible to model misspecification issues that often arise when modeling the conditional distributions of treatments. RBW is also advantageous from a computational perspective. As its weighting procedure involves a convex optimization problem, RBW typically locates a solution considerably faster than other methods whose optimization relies on nonconvex loss functions --- such as the recently proposed nonparametric version of CBPS. We explain the rationale behind RBW, describe the functions in [*rbw*](https://CRAN.R-project.org/package=rbw), and then use real-world data to illustrate their applications in three scenarios: effect estimation for point treatments, causal mediation analysis, and effect estimation for time-varying treatments with time-varying confounders.
Tidy Data Neatly Resolves Mass-Spectrometry's Ragged Arrays
Mass spectrometry (MS) is a powerful tool for measuring biomolecules, but the data produced is often difficult to handle computationally because it is stored as a ragged array. In R, this format is typically encoded in complex S4 objects built around environments, requiring an extensive background in R to perform even simple tasks. However, the adoption of tidy data [@wickham2014] provides an alternate data structure that is highly intuitive and works neatly with base R functions and common packages, as well as other programming languages. Here, we discuss the current state of R-based MS data processing, the convenience and challenges of integrating tidy data techniques into MS data processing, and present [*RaMS*](https://CRAN.R-project.org/package=RaMS), a package that produces tidy representations of MS data.

casebase: An Alternative Framework for Survival Analysis and Comparison of Event Rates
In clinical studies of time-to-event data, a quantity of interest to the clinician is their patient's risk of an event. However, methods relying on time matching or risk-set sampling (including Cox regression) eliminate the baseline hazard from the estimating function. As a consequence, the focus has been on reporting hazard ratios instead of survival or cumulative incidence curves. Indeed, reporting patient risk or cumulative incidence requires a separate estimation of the baseline hazard. Using case-base sampling, Hanley & Miettinen (2009) explained how parametric hazard functions can be estimated in continuous-time using logistic regression. Their approach naturally leads to estimates of the survival or risk function that are smooth-in-time. In this paper, we present the casebase R package, a comprehensive and flexible toolkit for parametric survival analysis. We describe how the case-base framework can also be used in more complex settings: non-linear functions of time and non-proportional hazards, competing risks, and variable selection. Our package also includes an extensive array of visualization tools to complement the analysis. We illustrate all these features through three different case studies. * SRB and MT contributed equally to this work.
logitFD: an R package for functional principal component logit regression
The functional logit regression model was proposed by [@Escabias04] with the objective of modeling a scalar binary response variable from a functional predictor. The model estimation proposed in that case was performed in a subspace of $L^2(T)$ of squared integrable functions of finite dimension, generated by a finite set of basis functions. For that estimation it was assumed that the curves of the functional predictor and the functional parameter of the model belong to the same finite subspace. The estimation so obtained was affected by high multicollinearity problems and the solution given to these problems was based on different functional principal component analysis. The [*logitFD*](https://CRAN.R-project.org/package=logitFD) package introduced here provides a toolbox for the fit of these models by implementing the different proposed solutions and by generalizing the model proposed in 2004 to the case of several functional and non-functional predictors. The performance of the functions is illustrated by using data sets of functional data included in the [*fda.usc*](https://CRAN.R-project.org/package=fda.usc) package from R-CRAN.
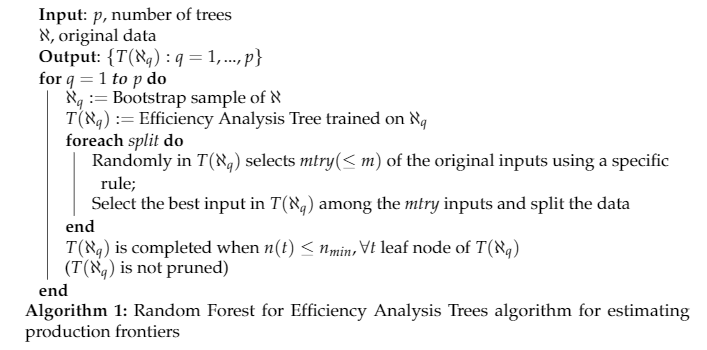
eat: An R Package for fitting Efficiency Analysis Trees
eat is a new package for R that includes functions to estimate production frontiers and technical efficiency measures through non-parametric techniques based upon regression trees. The package specifically implements the main algorithms associated with a recently introduced methodology for estimating the efficiency of a set of decision-making units in Economics and Engineering through Machine Learning techniques, called Efficiency Analysis Trees [@esteve2020]. The package includes code for estimating input- and output-oriented radial measures, input- and output-oriented Russell measures, the directional distance function and the weighted additive model, plotting graphical representations of the production frontier by tree structures, and determining rankings of importance of input variables in the analysis. Additionally, it includes the code to perform an adaptation of Random Forest in estimating technical efficiency. This paper describes the methodology and implementation of the functions, and reports numerical results using a real data base application.
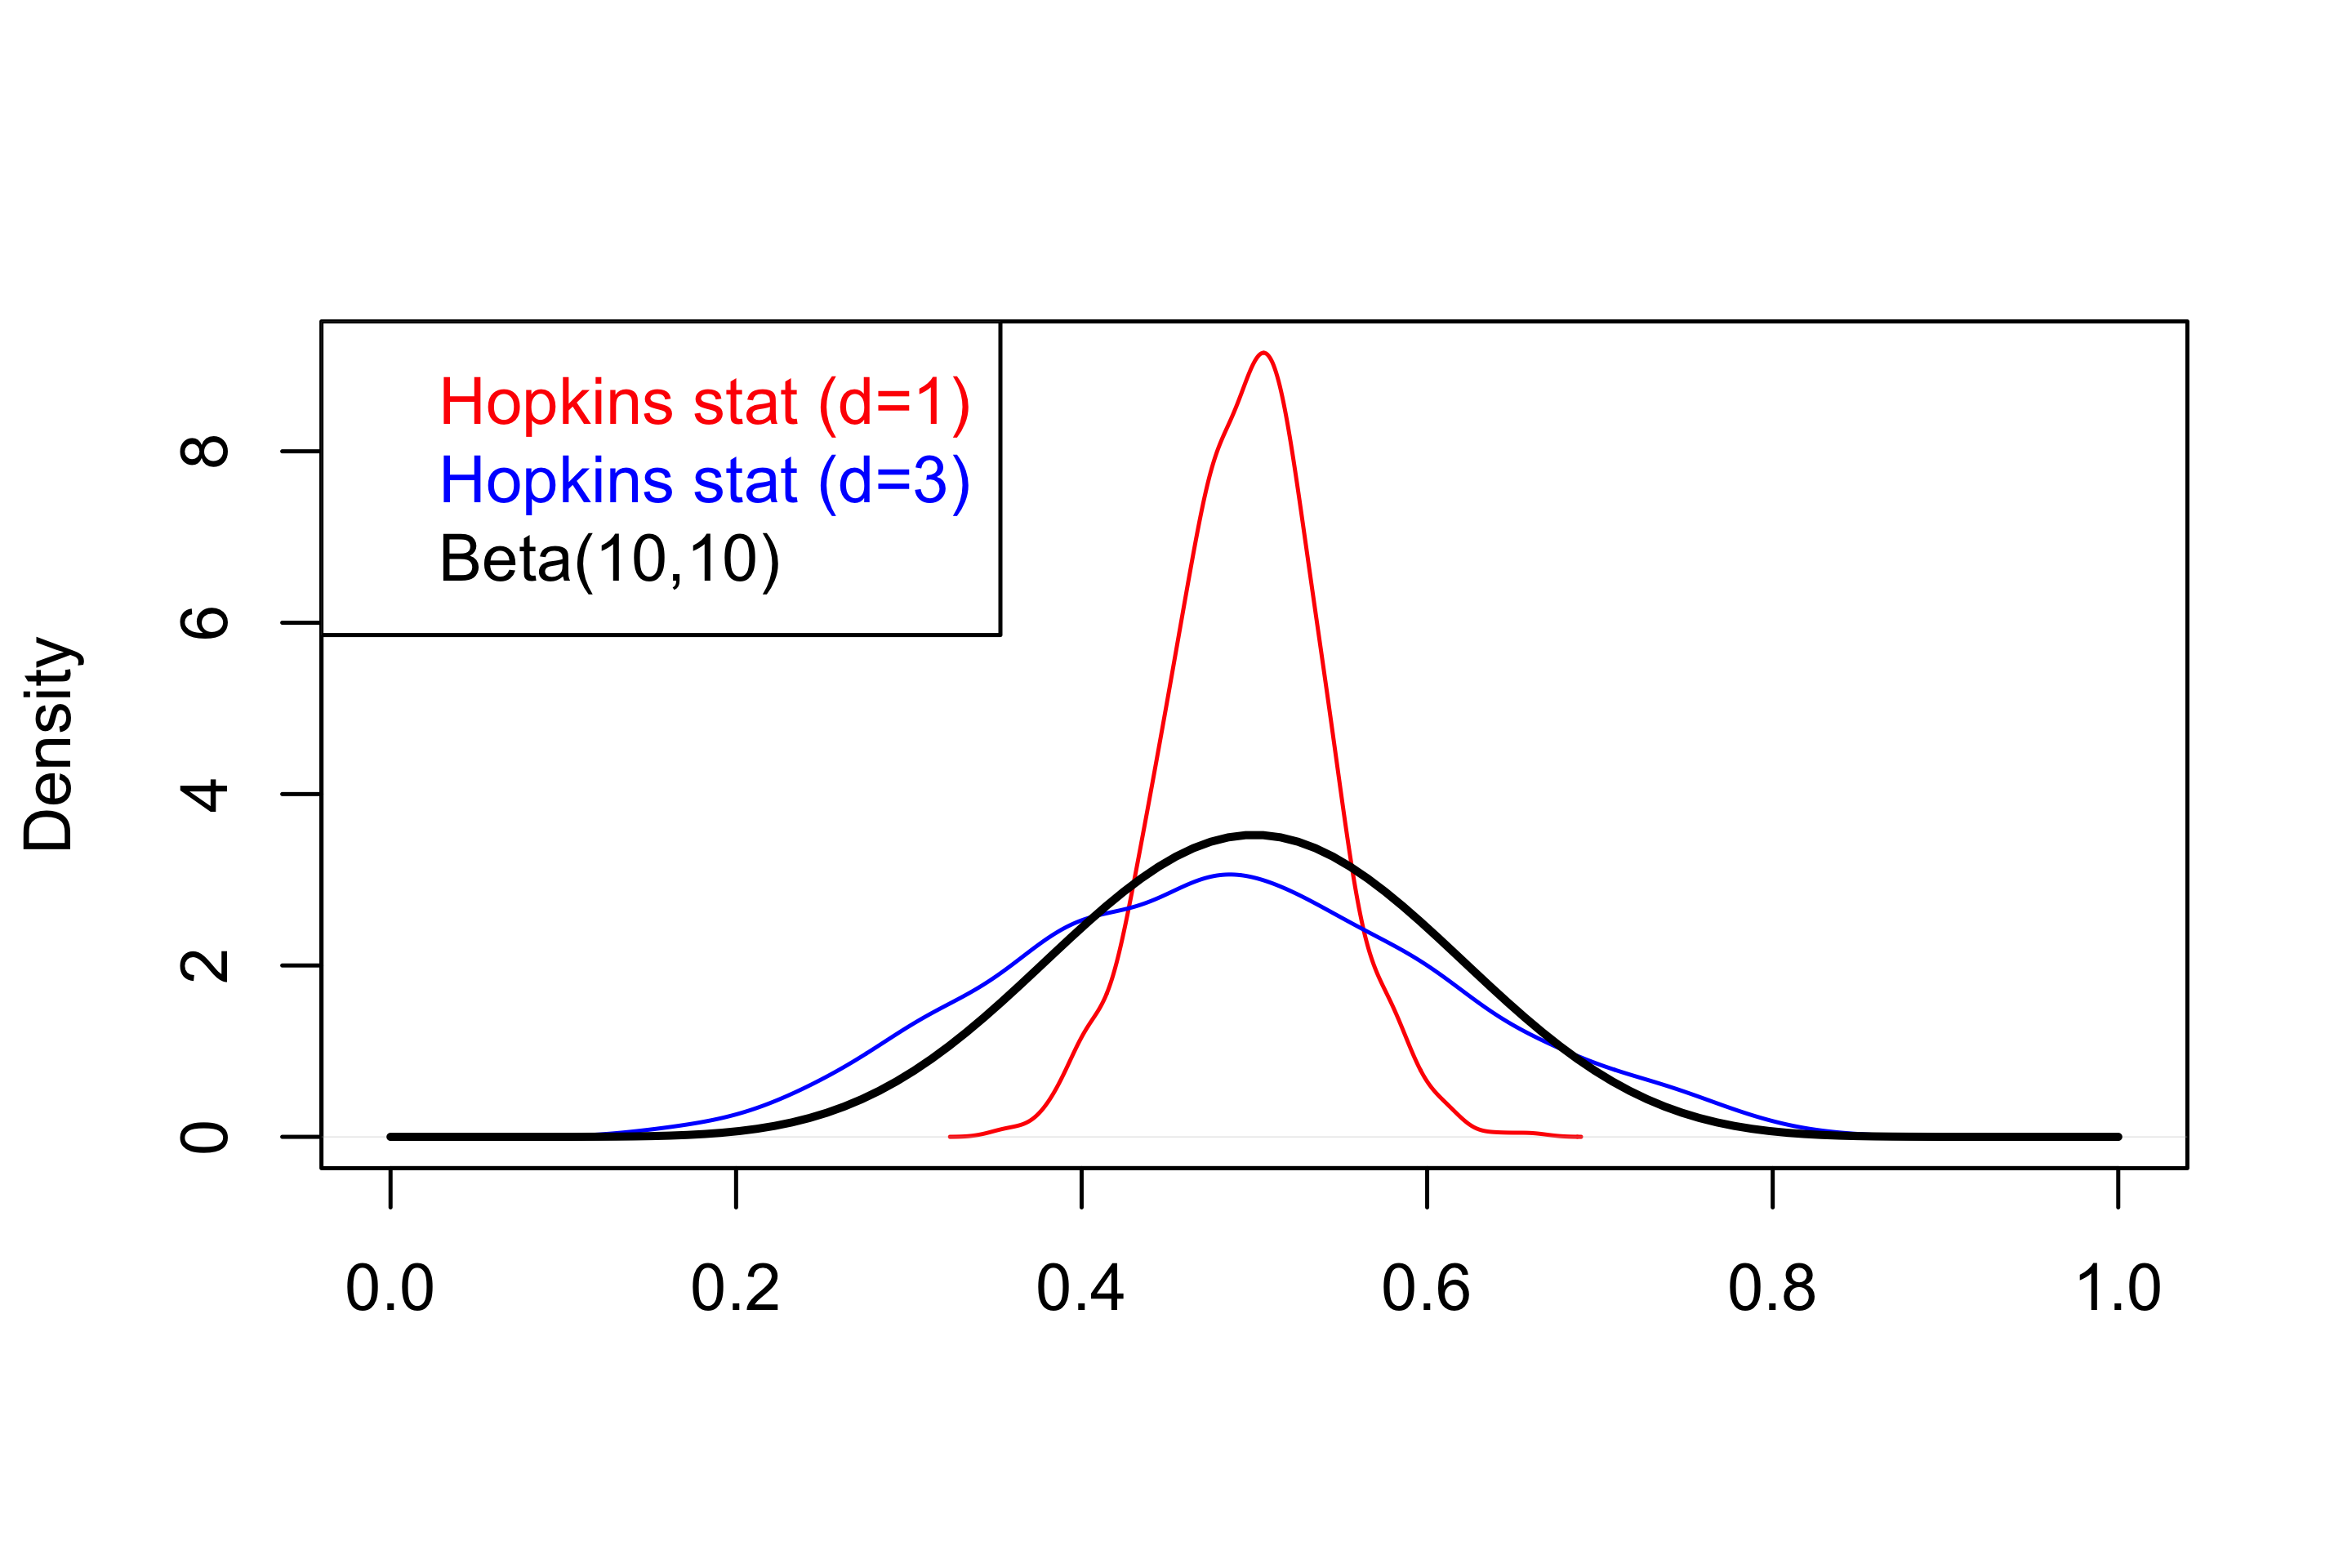
Will the Real Hopkins Statistic Please Stand Up?
Hopkins statistic [@hopkins1954new] can be used to test for spatial randomness of data and for detecting clusters in data. Although the method is nearly 70 years old, there is persistent confusion regarding the definition and calculation of the statistic. We investigate the confusion and its possible origin. Using the most general definition of Hopkins statistic, we perform a small simulation to verify its distributional properties, provide a visualization of how the statistic is calculated, and provide a fast R function to correctly calculate the statistic. Finally, we propose a protocol of five questions to guide the use of Hopkins statistic.
Multivariate Subgaussian Stable Distributions in R
We introduce and showcase [*mvpd*](https://CRAN.R-project.org/package=mvpd) (an acronym for *m*ulti*v*ariate *p*roduct *d*istributions), a package that uses a product distribution approach to calculating multivariate subgaussian stable distribution functions. The family of multivariate subgaussian stable distributions are elliptically contoured multivariate stable distributions that contain the multivariate Cauchy and the multivariate normal distribution. These distributions can be useful in modeling data and phenomena that have heavier tails than the normal distribution (more frequent occurrence of extreme values). Application areas include log returns for stocks, signal processing for radar and sonar data, astronomy, and hunting patterns of sharks.
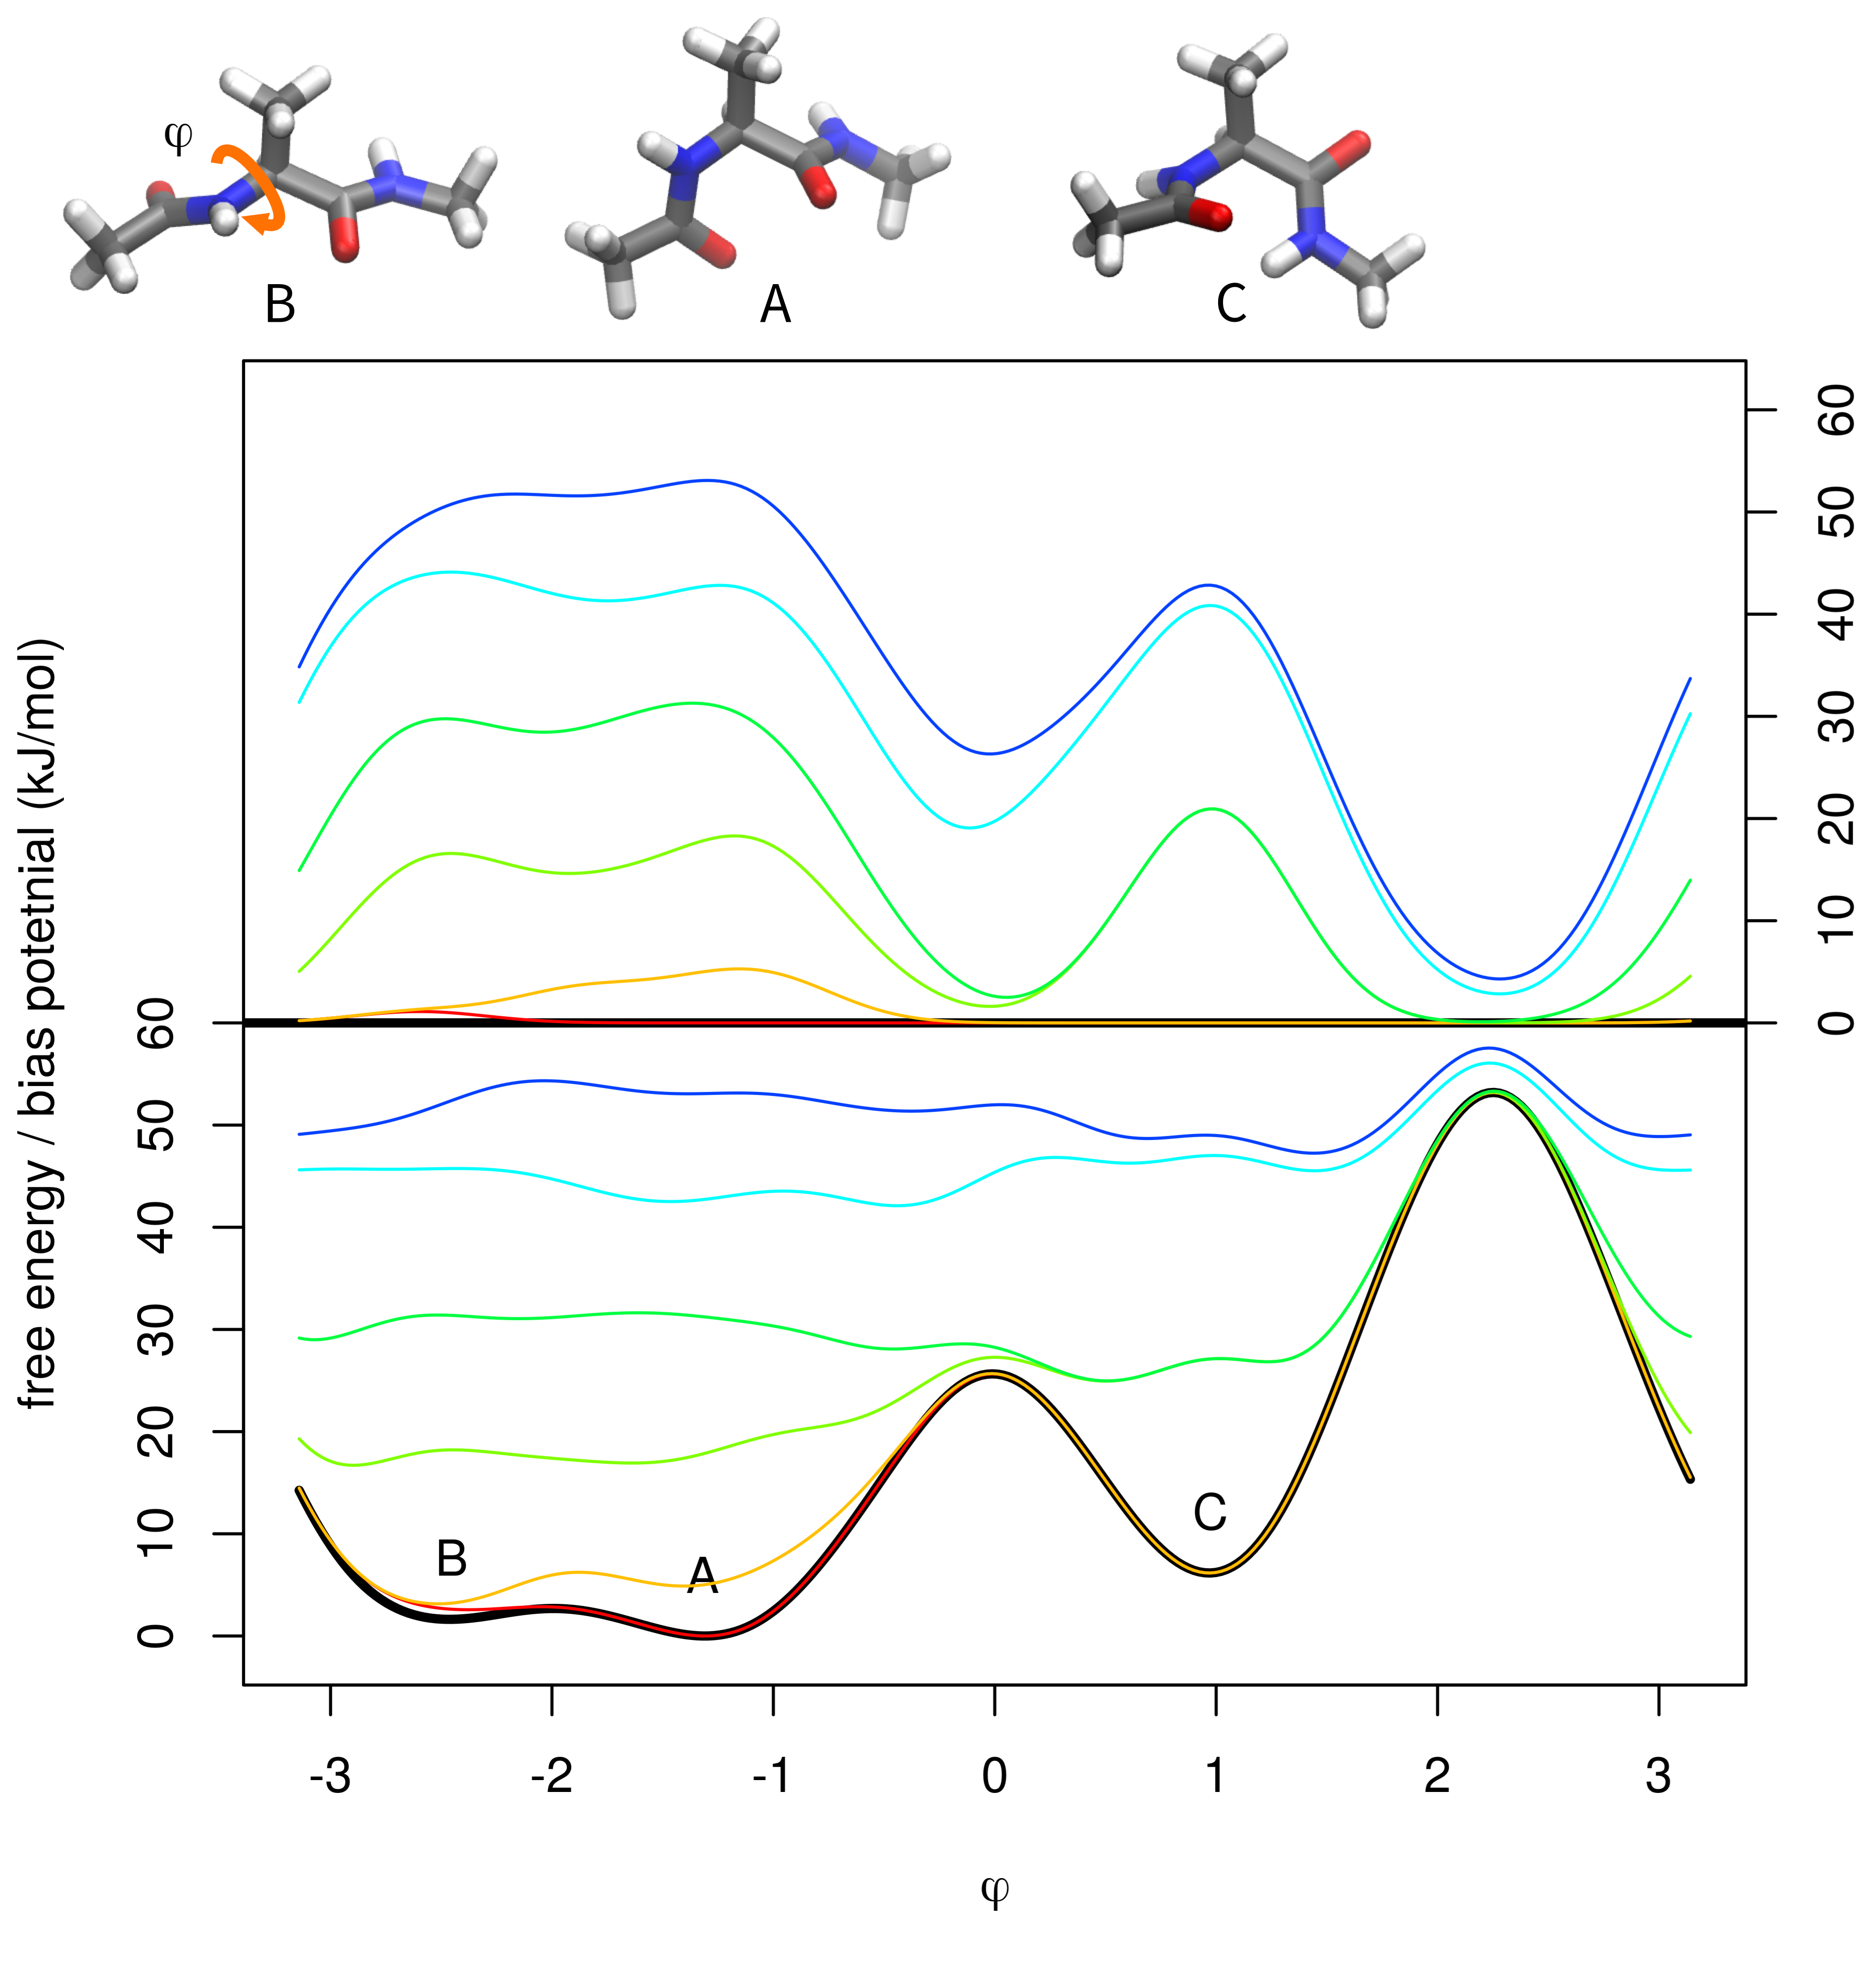
Analysis of the Results of Metadynamics Simulations by metadynminer and metadynminer3d
Molecular simulations solve the equation of motion of molecular systems, making the 3D shapes of molecules four-dimensional by adding the time coordinate. These methods have great potential in drug discovery because they can realistically model the structures of protein molecules targeted by drugs, as well as the process of binding of a potential drug to its molecular target. However, routine application of biomolecular simulations is hampered by the very high computational costs of this method. Several methods have been developed to address this problem. One of them, metadynamics, disfavors states of the simulated system that have been already visited and thus forces the system to explore new states. Here we present the package metadynminer and metadynminer3d to analyze and visualize results from metadynamics, in particular those produced by a popular metadynamics package Plumed.
CIMTx: An R Package for Causal Inference with Multiple Treatments using Observational Data
[*CIMTx*](https://CRAN.R-project.org/package=CIMTx) provides efficient and unified functions to implement modern methods for causal inferences with multiple treatments using observational data with a focus on binary outcomes. The methods include regression adjustment, inverse probability of treatment weighting, Bayesian additive regression trees, regression adjustment with multivariate spline of the generalized propensity score, vector matching and targeted maximum likelihood estimation. In addition, [*CIMTx*](https://CRAN.R-project.org/package=CIMTx) illustrates ways in which users can simulate data adhering to the complex data structures in the multiple treatment setting. Furthermore, the [*CIMTx*](https://CRAN.R-project.org/package=CIMTx) package offers a unique set of features to address the key causal assumptions: positivity and ignorability. For the positivity assumption, [*CIMTx*](https://CRAN.R-project.org/package=CIMTx) demonstrates techniques to identify the common support region for retaining inferential units using inverse probability of treatment weighting, Bayesian additive regression trees and vector matching. To handle the ignorability assumption, [*CIMTx*](https://CRAN.R-project.org/package=CIMTx) provides a flexible Monte Carlo sensitivity analysis approach to evaluate how causal conclusions would be altered in response to different magnitude of departure from ignorable treatment assignment.
Introducing fastpos: A Fast R Implementation to Find the Critical Point of Stability for a Correlation
The R package fastpos provides a fast algorithm to estimate the required sample size for a Pearson correlation to *stabilize* [@schonbrodt2013]. The stability approach is an innovative alternative to other means of sample size planning, such as power analysis. Although the approach is young, it has already attracted much interest in the research community. Still, to date, there exists no easy way to use the stability approach because there is no analytical solution and a simulation approach is computationally expensive with a quadratic time complexity. The presented package overcomes this limitation by speeding up the calculation of correlations and achieving linear time complexity. For typical parameters, the theoretical speedup is around a factor of 250, which was empirically confirmed in a comparison with the original implementation `corEvol`. This speedup allows practitioners to use the stability approach to plan for sample size and theoreticians to further explore the method.

brolgar: An R package to BRowse Over Longitudinal Data Graphically and Analytically in R
Longitudinal (panel) data provide the opportunity to examine temporal patterns of individuals, because measurements are collected on the same person at different, and often irregular, time points. The data is typically visualised using a "spaghetti plot", where a line plot is drawn for each individual. When overlaid in one plot, it can have the appearance of a bowl of spaghetti. With even a small number of subjects, these plots are too overloaded to be read easily. The interesting aspects of individual differences are lost in the noise. Longitudinal data is often modelled with a hierarchical linear model to capture the overall trends, and variation among individuals, while accounting for various levels of dependence. However, these models can be difficult to fit, and can miss unusual individual patterns. Better visual tools can help to diagnose longitudinal models, and better capture the individual experiences. This paper introduces the R package, brolgar (BRowse over Longitudinal data Graphically and Analytically in R), which provides tools to identify and summarise interesting individual patterns in longitudinal data.

akc: A Tidy Framework for Automatic Knowledge Classification in R
Knowledge classification is an extensive and practical approach in domain knowledge management. Automatically extracting and organizing knowledge from unstructured textual data is desirable and appealing in various circumstances. In this paper, the tidy framework for automatic knowledge classification supported by the akc package is introduced. With powerful support from the R ecosystem, the akc framework can handle multiple procedures in data science workflow, including text cleaning, keyword extraction, synonyms consolidation and data presentation. While focusing on bibliometric analysis, the akc package is extensible to be used in other contexts. This paper introduces the framework and its features in detail. Specific examples are given to guide the potential users and developers to participate in open science of text mining.

Quantifying Population Movement Using a Novel Implementation of Digital Image Correlation in the ICvectorfields Package
Movements in imagery captivate the human eye and imagination. They are also of interest in variety of scientific disciplines that study spatiotemporal dynamics. Popular methods for quantifying movement in imagery include particle image velocimetry and digital image correlation. Both methods are widely applied in engineering and materials science, but less applied in other disciplines. This paper describes an implementation of a basic digital image correlation algorithm in R as well as an extension designed to quantify persistent movement velocities in sequences of three or more images. Algorithms are applied in the novel arena of landscape ecology to quantify population movement and to produce vector fields for easy visualization of complex movement patterns across space. Functions to facilitate analyses are available in ICvectorfields \citep{ICvf}. These methods and functions are likely to produce novel insights in theoretical and landscape ecology because they facilitate visualization and comparison of theoretical and observed data in complex and heterogeneous environments.
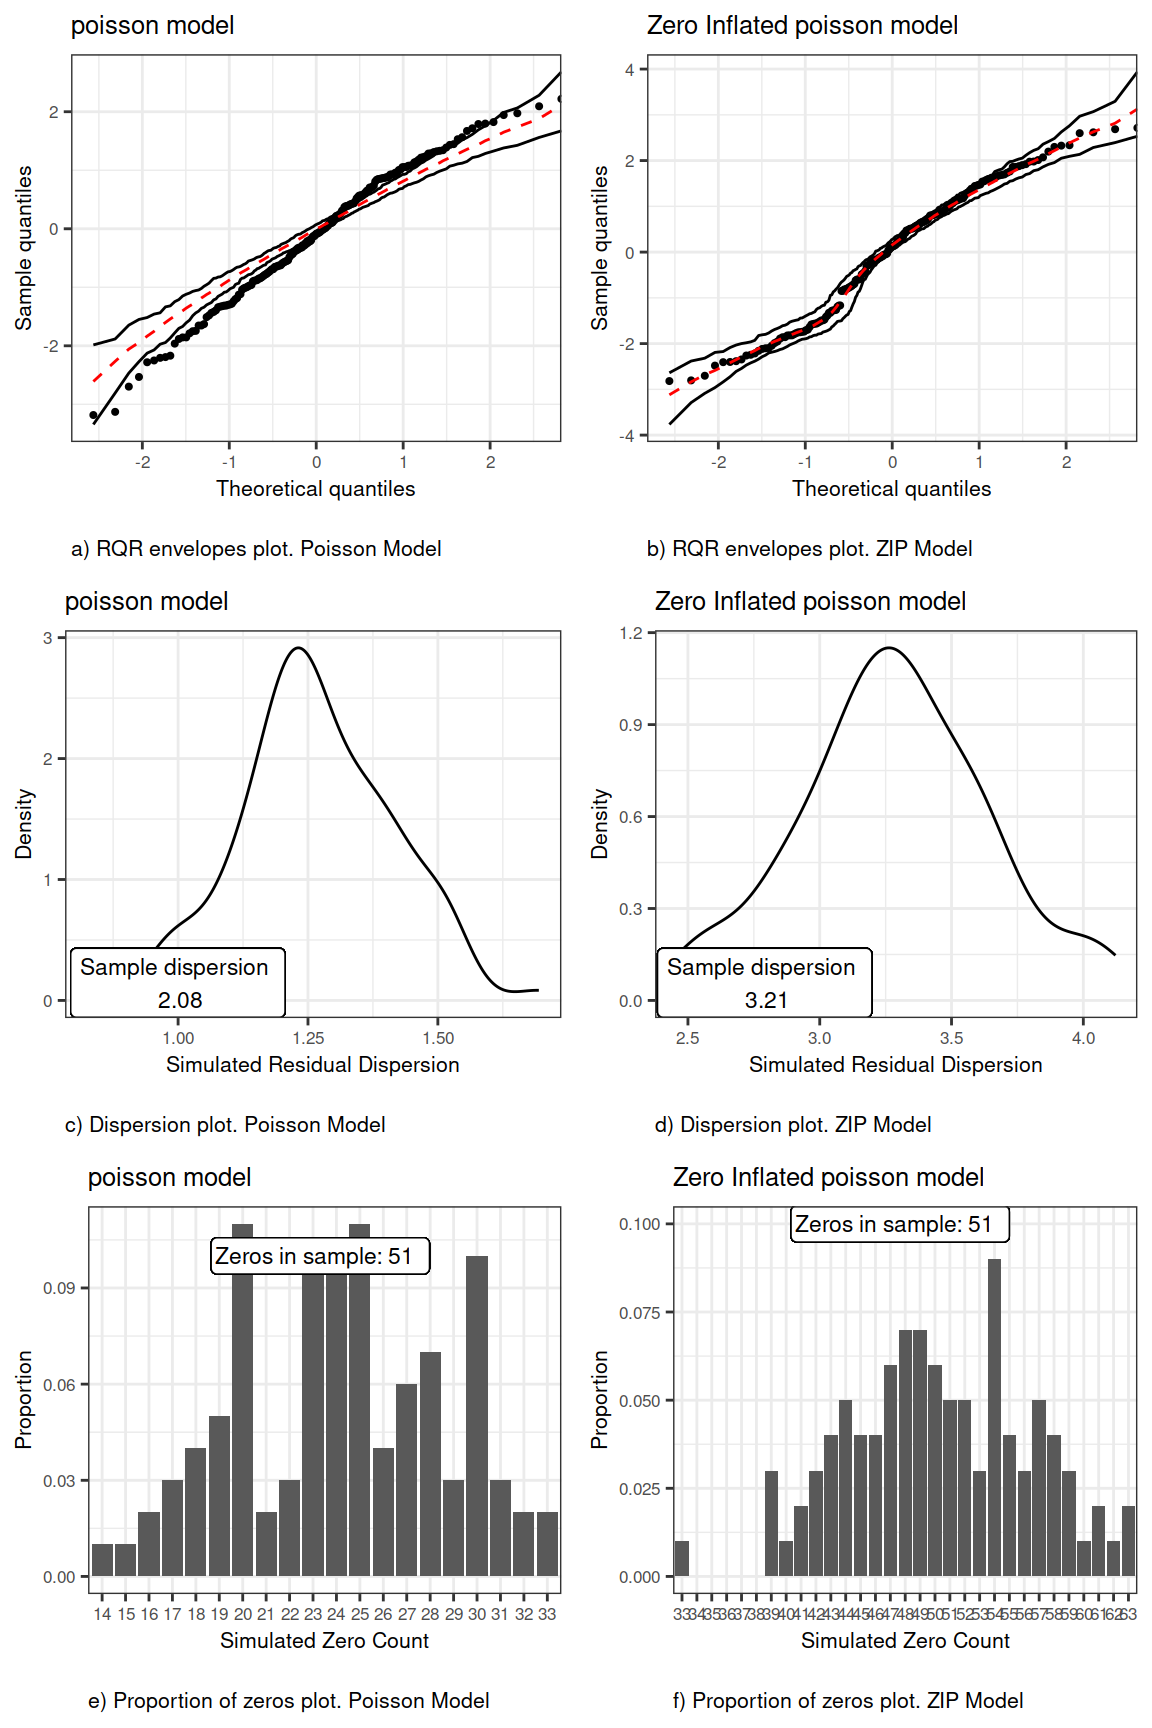
iccCounts: An R Package to Estimate the Intraclass Correlation Coefficient for Assessing Agreement with Count Data
The intraclass correlation coefficient (ICC) is a widely used index to assess agreement with continuous data. The common approach for estimating the ICC involves estimating the variance components of a linear mixed model under assumptions such as linearity and normality of effects. However, if the outcomes are counts these assumptions are not met and the ICC estimates are biased and inefficient. In this situation, it is necessary to use alternative approaches that are better suited for count data. Here, the iccCounts R package is introduced for estimating the ICC under the Poisson, Negative Binomial, Zero-Inflated Poisson and Zero-Inflated Negative Binomial distributions. The utility of the iccCounts package is illustrated by three examples that involve the assessment of repeatability and concordance with count data.

An Open-Source Implementation of the CMPS Algorithm for Assessing Similarity of Bullets
In this paper, we introduce the R package cmpsR, an open-source implementation of the Congruent Matching Profile Segments (CMPS) method developed at the National Institute of Standards and Technology (NIST) for objective comparison of striated tool marks. The functionality of the package is showcased by examples of bullet signatures that come with the package. Graphing tools are implemented in the package as well for users to assess and understand the CMPS results. Initial tests were performed on bullet signatures generated from two sets of 3D scans in the Hamby study under the framework suggested by the R package `bulletxtrctr`. New metrics based on CMPS scores are introduced and compared with existing metrics. A measure called sum of squares ratio is included, and how it can be used for evaluating different scans, metrics, or parameters is showcased with the Hamby study data sets. An open-source implementation of the CMPS algorithm makes the algorithm more accessible, generates reproducible results, and facilitates further studies of the algorithm such as method comparisons.
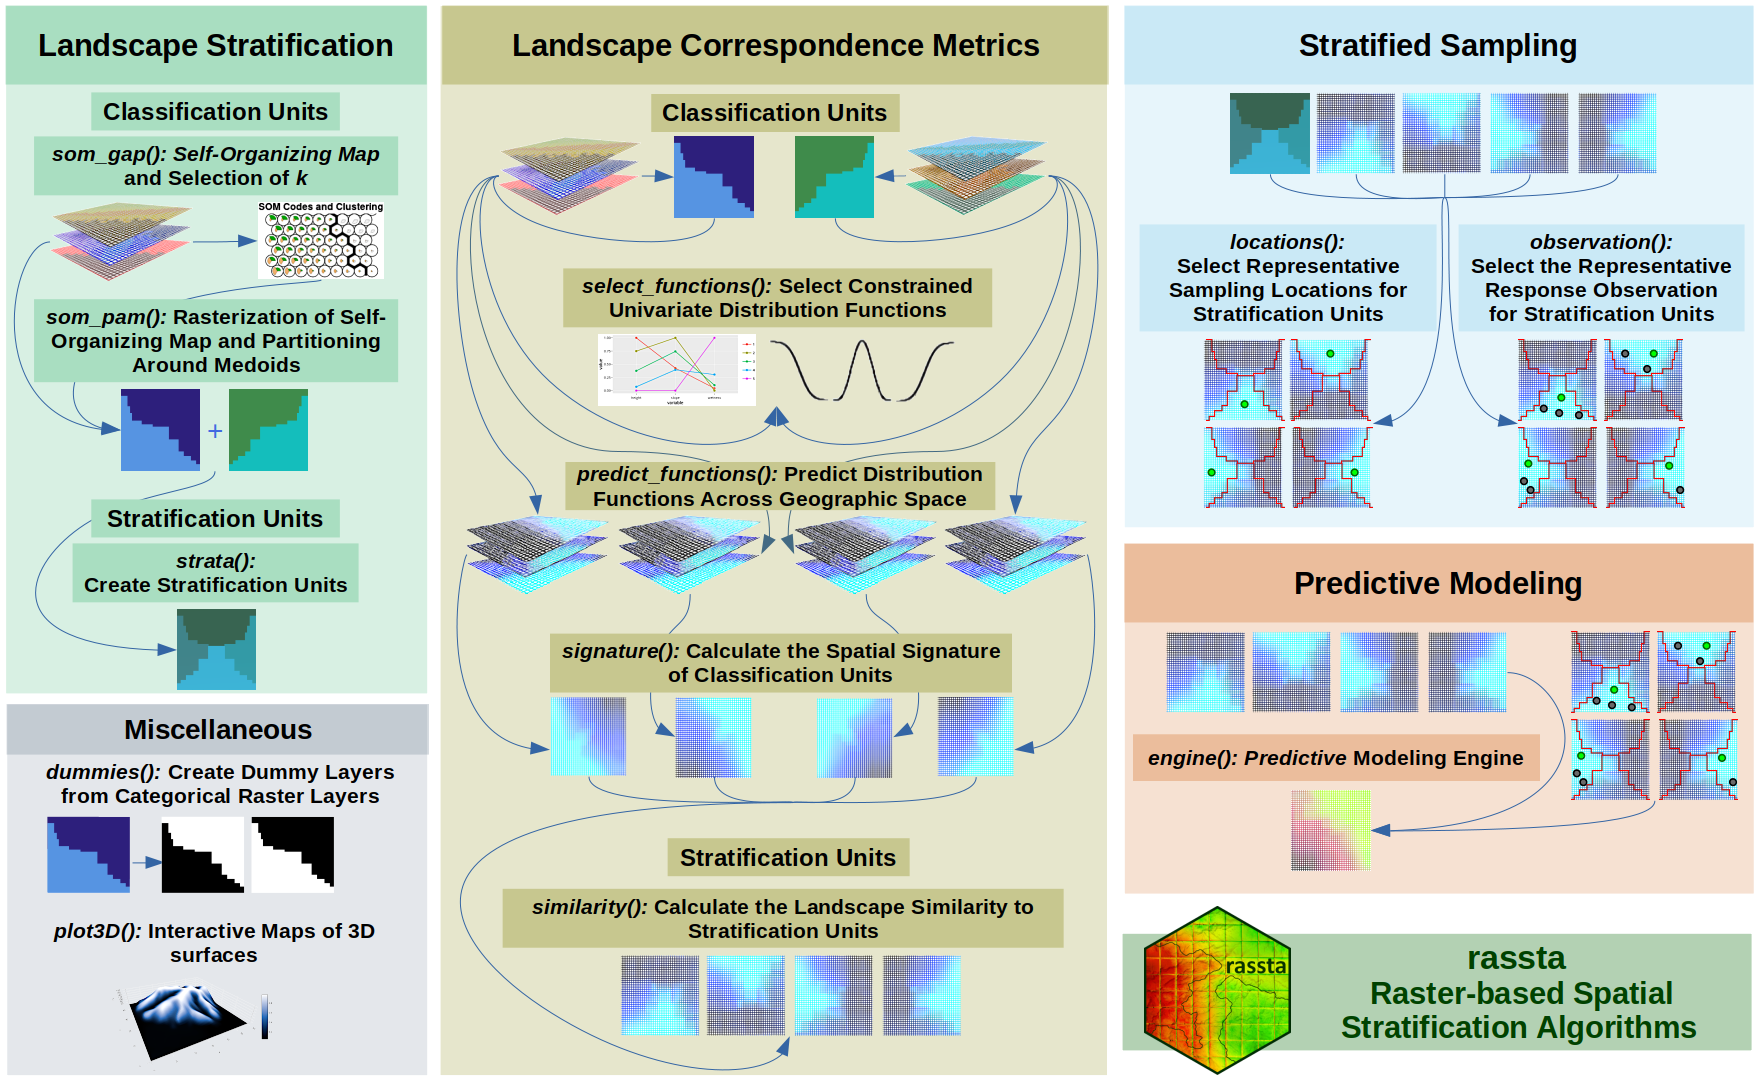
rassta: Raster-Based Spatial Stratification Algorithms
Spatial stratification of landscapes allows for the development of efficient sampling surveys, the inclusion of domain knowledge in data-driven modeling frameworks, and the production of information relating the spatial variability of response phenomena to that of landscape processes. This work presents the rassta package as a collection of algorithms dedicated to the spatial stratification of landscapes, the calculation of landscape correspondence metrics across geographic space, and the application of these metrics for spatial sampling and modeling of environmental phenomena. The theoretical background of rassta is presented through references to several studies which have benefited from landscape stratification routines. The functionality of rassta is presented through code examples which are complemented with the geographic visualization of their outputs.
htestClust: A Package for Marginal Inference of Clustered Data Under Informative Cluster Size
When observations are collected in/organized into observational units, within which observations may be dependent, those observational units are often referred to as \"clustered\" and the data as \"clustered data\". Examples of clustered data include repeated measures or hierarchical shared association (e.g., individuals within families). This paper provides an overview of the R package [*htestClust*](https://CRAN.R-project.org/package=htestClust), a tool for the marginal analysis of such clustered data with potentially informative cluster and/or group sizes. Contained in *htestClust* are clustered data analogues to the following classical hypothesis tests: rank-sum, signed rank, $t$-, one-way ANOVA, F, Levene, Pearson/Spearman/Kendall correlation, proportion, goodness-of-fit, independence, and McNemar. Additional functions allow users to visualize and test for informative cluster size. This package has an easy-to-use interface mimicking that of classical hypothesis-testing functions in the R environment. Various features of this package are illustrated through simple examples.
APCI: An R and Stata Package for Visualizing and Analyzing Age-Period-Cohort Data
Social scientists have frequently attempted to assess the relative contribution of age, period, and cohort variables to the overall trend in an outcome. We develop an R package [*APCI*](https://CRAN.R-project.org/package=APCI) (and Stata command `apci`) to implement the age-period-cohort-interaction (APC-I) model for estimating and testing age, period, and cohort patterns in various types of outcomes for pooled cross-sectional data and multi-cohort panel data. Package [*APCI*](https://CRAN.R-project.org/package=APCI) also provides a set of functions for visualizing the data and modeling results. We demonstrate the usage of package [*APCI*](https://CRAN.R-project.org/package=APCI) with empirical data from the Current Population Survey. We show that package [*APCI*](https://CRAN.R-project.org/package=APCI) provides useful visualization and analytical tools for understanding age, period, and cohort trends in various types of outcomes.
shinybrms: Fitting Bayesian Regression Models Using a Graphical User Interface for the R Package brms
Despite their advantages, the application of Bayesian regression models is still the exception compared to frequentist regression models. Here, we present our R package [*shinybrms*](https://CRAN.R-project.org/package=shinybrms) which provides a graphical user interface for fitting Bayesian regression models, with the frontend consisting of a [*shiny*](https://CRAN.R-project.org/package=shiny) app and the backend relying on the R package [*brms*](https://CRAN.R-project.org/package=brms) which in turn relies on Stan. With *shinybrms*, we hope that Bayesian regression models (and regression models in general) will become more popular in applied research, data analyses, and teaching. Here, we illustrate our graphical user interface by the help of an example from medical research.
Refreg: An R Package for Estimating Conditional Reference Regions
Multivariate reference regions (MVR) represent the extension of the reference interval concept to the multivariate setting. A reference interval is defined by two threshold points between which a high percentage of healthy subjects' results, usually 95%, are contained. Analogously, an MVR characterizes the values of several diagnostic tests most frequently found among non-diseased subjects by defining a convex hull containing 95% of the results. MVRs have great applicability when working with diseases that are diagnosed via more than one continuous test, e.g., diabetes or hypothyroidism. The present work introduces *refreg*, an R package for estimating conditional MVRs. The reference region is non-parametrically estimated using a multivariate kernel density estimator, and its shape allowed to change under the influence of covariates. The effects of covariates on the multivariate variable means, and on their variance-covariance matrix, are estimated by flexible additive predictors. Continuous covariate non-linear effects can be estimated by penalized spline smoothers. The package allows the user to propose, for instance, an age-specific diagnostic rule based on the joint distribution of two non-Gaussian, continuous test results. The usefulness of the *refreg* package in clinical practice is illustrated with a real case in diabetes research, with an age-specific reference region proposed for the joint interpretation of two glycemia markers (fasting plasma glucose and glycated hemoglobin). To show that the *refreg* package can also be used in other, and indeed very different fields, an example is provided for the joint prediction of two atmospheric pollutants (SO$_2$, and NO$_x$). Additionally, the text discusses how, conceptually, this method could be extended to more than two dimensions.
TensorTest2D: Fitting Generalized Linear Models with Matrix Covariates
The [*TensorTest2D*](https://CRAN.R-project.org/package=TensorTest2D) package provides the means to fit generalized linear models on second-order tensor type data. Functions within this package can be used for parameter estimation (e.g., estimating regression coefficients and their standard deviations) and hypothesis testing. We use two examples to illustrate the utility of our package in analyzing data from different disciplines. In the first example, a tensor regression model is used to study the effect of multi-omics predictors on a continuous outcome variable which is associated with drug sensitivity. In the second example, we draw a subset of the MNIST handwritten images and fit to them a logistic tensor regression model. A significance test characterizes the image pattern that tells the difference between two handwritten digits. We also provide a function to visualize the areas as effective classifiers based on a tensor regression model. The visualization tool can also be used together with other variable selection techniques, such as the LASSO, to inform the selection results.
wavScalogram: An R Package with Wavelet Scalogram Tools for Time Series Analysis
In this work we present the *wavScalogram* R package, which contains methods based on wavelet scalograms for time series analysis. These methods are related to two main wavelet tools: the windowed scalogram difference and the scale index. The windowed scalogram difference compares two time series, identifying if their scalograms follow similar patterns at different scales and times, and it is thus a useful complement to other comparison tools such as the squared wavelet coherence. On the other hand, the scale index provides a numerical estimation of the degree of non-periodicity of a time series and it is widely used in many scientific areas.
ClusTorus: An R Package for Prediction and Clustering on the Torus by Conformal Prediction
Protein structure data consist of several dihedral angles, lying on a multidimensional torus. Analyzing such data has been and continues to be key in understanding functional properties of proteins. However, most of the existing statistical methods assume that data are on Euclidean spaces, and thus they are improper to deal with angular data. In this paper, we introduce the package *ClusTorus* specialized to analyzing multivariate angular data. The package collects some tools and routines to perform algorithmic clustering and model-based clustering for data on the torus. In particular, the package enables the construction of conformal prediction sets and predictive clustering, based on kernel density estimates and mixture model estimates. A novel hyperparameter selection strategy for predictive clustering is also implemented, with improved stability and computational efficiency. We demonstrate the use of the package in clustering protein dihedral angles from two real data sets.
kStatistics: Unbiased Estimates of Joint Cumulant Products from the Multivariate Faà Di Bruno's Formula
kStatistics is a package in `R` that serves as a unified framework for estimating univariate and multivariate cumulants as well as products of univariate and multivariate cumulants of a random sample, using unbiased estimators with minimum variance. The main computational machinery of kStatistics is an algorithm for computing multi-index partitions. The same algorithm underlies the general-purpose multivariate Faà di Bruno's formula, which therefore has been included in the last release of the package. This formula gives the coefficients of formal power series compositions as well as the partial derivatives of multivariable function compositions. One of the most significant applications of this formula is the possibility to generate many well-known polynomial families as special cases. So, in the package, there are special functions for generating very popular polynomial families, such as the Bell polynomials. However, further families can be obtained, for suitable choices of the formal power series involved in the composition or when suitable symbolic strategies are employed. In both cases, we give examples on how to modify the `R` codes of the package to accomplish this task. Future developments are addressed at the end of the paper
PDFEstimator: An R Package for Density Estimation and Analysis
This article presents *PDFEstimator*, an R package for nonparametric probability density estimation and analysis, as both a practical enhancement and alternative to kernel-based estimators. *PDFEstimator* creates fast, highly accurate, data-driven probability density estimates for continuous random data through an intuitive interface. Excellent results are obtained for a diverse set of data distributions ranging from 10 to $10^6$ samples when invoked with default parameter definitions in the absence of user directives. Additionally, the package contains methods for assessing the quality of any estimate, including robust plotting functions for detailed visualization and trouble-shooting. Usage of *PDFEstimator* is illustrated through a variety of examples, including comparisons to several kernel density methods.
reclin2: a Toolkit for Record Linkage and Deduplication
The goal of record linkage and deduplication is to detect which records belong to the same object in data sets where the identifiers of the objects contain errors and missing values. The main design considerations of *reclin2* are: modularity/flexibility, speed and the ability to handle large data sets. The first points makes it easy for users to extend the package with custom process steps. This flexibility is obtained by using simple data structures and by following as close as possible common interfaces in R. For large problems it is possible to distribute the work over multiple worker nodes. A benchmark comparison to other record linkage packages for R, shows that for this specific benchmark, the *fastLink* package performs best. However, this package only performs one specific type of record linkage model. The performance of *reclin2* is not far behind the of *fastLink* while allowing for much greater flexibility.
The Concordance Test, an Alternative to Kruskal-Wallis Based on the Kendall-tau Distance: An R Package
The Kendall rank correlation coefficient, based on the Kendall-$\tau$ distance, is used to measure the ordinal association between two measurements. In this paper, we introduce a new coefficient also based on the Kendall-$\tau$ distance, the Concordance coefficient, and a test to measure whether different samples come from the same distribution. This work also presents a new R package, *ConcordanceTest*, with the implementation of the proposed coefficient. We illustrate the use of the Concordance coefficient to measure the ordinal association between quantity and quality measures when two or more samples are considered. In this sense, the Concordance coefficient can be seen as a generalization of the Kendall rank correlation coefficient and an alternative to the non-parametric mean rank-based methods for comparing two or more samples. A comparison of the proposed Concordance coefficient and the classical Kruskal-Wallis statistic is presented through a comparison of the exact distributions of both statistics.
R-miss-tastic: a unified platform for missing values methods and workflows
Missing values are unavoidable when working with data. Their occurrence is exacerbated as more data from different sources become available. However, most statistical models and visualization methods require complete data, and improper handling of missing data results in information loss or biased analyses. Since the seminal work of Rubin (1976), a burgeoning literature on missing values has arisen, with heterogeneous aims and motivations. This led to the development of various methods, formalizations, and tools. For practitioners, however, it remains a challenge to decide which method is most appropriate for their problem, in part because this topic is not systematically covered in statistics or data science curricula. To help address this challenge, we have launched the `R-miss-tastic` platform, which aims to provide an overview of standard missing values problems, methods, and relevant implementations of methodologies. Beyond gathering and organizing a large majority of the material on missing data (bibliography, courses, tutorials, implementations), `R-miss-tastic` covers the development of standardized analysis workflows. Indeed, we have developed several pipelines in R and Python to allow for hands-on illustration of and recommendations on missing values handling in various statistical tasks such as matrix completion, estimation, and prediction, while ensuring reproducibility of the analyses. Finally, the platform is dedicated to users who analyze incomplete data, researchers who want to compare their methods and search for an up-to-date bibliography, and teachers who are looking for didactic materials (notebooks, recordings, lecture notes).
Power and Sample Size for Longitudinal Models in R -- The longpower Package and Shiny App
Longitudinal studies are ubiquitous in medical and clinical research. Sample size computations are critical to ensure that these studies are sufficiently powered to provide reliable and valid inferences. There are several methodologies for calculating sample sizes for longitudinal studies that depend on many considerations including the study design features, outcome type and distribution, and proposed analytical methods. We briefly review the literature and describe sample size formulas for continuous longitudinal data. We then apply the methods using example studies comparing treatment versus control groups in randomized trials assessing treatment effect on clinical outcomes. We also introduce a Shiny app that we developed to assist researchers with obtaining required sample sizes for longitudinal studies by allowing users to enter required pilot estimates. For Alzheimer's studies, the app can estimate required pilot parameters using data from the Alzheimer's Disease Neuroimaging Initiative (ADNI). Illustrative examples are used to demonstrate how the package and app can be used to generate sample size and power curves. The package and app are designed to help researchers easily assess the operating characteristics of study designs for Alzheimer's clinical trials and other research studies with longitudinal continuous outcomes. Data used in preparation of this article were obtained from the Alzheimer's Disease Neuroimaging Initiative (ADNI) database (adni.loni.usc.edu).

fairmodels: a Flexible Tool for Bias Detection, Visualization, and Mitigation in Binary Classification Models
Machine learning decision systems are becoming omnipresent in our lives. From dating apps to rating loan seekers, algorithms affect both our well-being and future. Typically, however, these systems are not infallible. Moreover, complex predictive models are eager to learn social biases present in historical data that may increase discrimination. If we want to create models responsibly, we need tools for in-depth validation of models also from potential discrimination. This article introduces an R package fairmodels that helps to validate fairness and eliminate bias in binary classification models quickly and flexibly. The fairmodels package offers a model-agnostic approach to bias detection, visualization, and mitigation. The implemented functions and fairness metrics enable model fairness validation from different perspectives. In addition, the package includes a series of methods for bias mitigation that aim to diminish the discrimination in the model. The package is designed to examine a single model and facilitate comparisons between multiple models.
tvReg: Time-varying Coefficients in Multi-Equation Regression in R
This article explains the usage of R package [*tvReg*](https://CRAN.R-project.org/package=tvReg), publicly available for download from the Comprehensive R Archive Network, via its application to economic and finance problems. The six basic functions in this package cover the kernel estimation of semiparametric panel data, seemingly unrelated equations, vector autoregressive, impulse response, and linear regression models whose coefficients may vary with time or any random variable. Moreover, this package provides methods for the graphical display of results, forecast, prediction, extraction of the residuals and fitted values, bandwidth selection and nonparametric estimation of the time-varying variance-covariance matrix of the error term. Applications to risk management, portfolio management, asset management and monetary policy are used as examples of these functions usage.
PSweight: An R Package for Propensity Score Weighting Analysis
Propensity score weighting is an important tool for comparative effectiveness research. Besides the inverse probability of treatment weights (IPW), recent development has introduced a general class of balancing weights, corresponding to alternative target populations and estimands. In particular, the overlap weights (OW) lead to optimal covariate balance and estimation efficiency, and a target population of scientific and policy interest. We develop the R package [*PSweight*](https://CRAN.R-project.org/package=PSweight) to provide a comprehensive design and analysis platform for causal inference based on propensity score weighting. *PSweight* supports (i) a variety of balancing weights, (ii) binary and multiple treatments, (iii) simple and augmented weighting estimators, (iv) nuisance-adjusted sandwich variances, and (v) ratio estimands. *PSweight* also provides diagnostic tables and graphs for covariate balance assessment. We demonstrate the functionality of the package using a data example from the National Child Development Survey (NCDS), where we evaluate the causal effect of educational attainment on income.
spherepc: An R Package for Dimension Reduction on a Sphere
Dimension reduction is a technique that can compress given data and reduce noise. Recently, a dimension reduction technique on spheres, called spherical principal curves (SPC), has been proposed. SPC fits a curve that passes through the middle of data with a stationary property on spheres. In addition, a study of local principal geodesics (LPG) is considered to identify the complex structure of data. Through the description and implementation of various examples, this paper introduces an R package [*spherepc*](https://CRAN.R-project.org/package=spherepc) for dimension reduction of data lying on a sphere, including existing methods, SPC and LPG.
blindrecalc - An R Package for Blinded Sample Size Recalculation
Besides the type 1 and type 2 error rate and the clinically relevant effect size, the sample size of a clinical trial depends on so-called nuisance parameters for which the concrete values are usually unknown when a clinical trial is planned. When the uncertainty about the magnitude of these parameters is high, an internal pilot study design with a blinded sample size recalculation can be used to achieve the target power even when the initially assumed value for the nuisance parameter is wrong. In this paper, we present the R-package *blindrecalc* that helps with planning a clinical trial with such a design by computing the operating characteristics and the distribution of the total sample size under different true values of the nuisance parameter. We implemented methods for continuous and binary outcomes in the superiority and the non-inferiority setting.
RKHSMetaMod: An R Package to Estimate the Hoeffding Decomposition of a Complex Model by Solving RKHS Ridge Group Sparse Optimization Problem
In this paper, we propose an R package, called [*RKHSMetaMod*](https://CRAN.R-project.org/package=RKHSMetaMod), that implements a procedure for estimating a meta-model of a complex model. The meta-model approximates the Hoeffding decomposition of the complex model and allows us to perform sensitivity analysis on it. It belongs to a reproducing kernel Hilbert space that is constructed as a direct sum of Hilbert spaces. The estimator of the meta-model is the solution of a penalized empirical least-squares minimization with the sum of the Hilbert norm and the empirical $L^2$-norm. This procedure, called RKHS ridge group sparse, allows both to select and estimate the terms in the Hoeffding decomposition, and therefore, to select and estimate the Sobol indices that are non-zero. The [*RKHSMetaMod*](https://CRAN.R-project.org/package=RKHSMetaMod) package provides an interface from the R statistical computing environment to the C++ libraries *Eigen* and *GSL*. In order to speed up the execution time and optimize the storage memory, except for a function that is written in R, all of the functions of this package are written using the efficient C++ libraries through [*RcppEigen*](https://CRAN.R-project.org/package=RcppEigen) and [*RcppGSL*](https://CRAN.R-project.org/package=RcppGSL) packages. These functions are then interfaced in the R environment in order to propose a user-friendly package.
Measuring the Extent and Patterns of Urban Shrinkage for Small Towns Using R
Urban shrinking is a phenomenon as common as urban expansion nowadays and it affects urban settlements of all sizes, especially from developed and industrialized countries in Europe, America and Asia. The paper aims to assess the patterns of shrinkage for small and medium sized towns in Oltenia region (Romania), considering demographic, economic and social indicators with a methodological approach which considers the use of different functions and applications of R packages. Thirteen selected indicators are analysed to perform the multivariate analysis on Principal Component Analysis using the `prcomp()` function and the [*ggplot2*](https://CRAN.R-project.org/package=ggplot2) package to visualize the patterns of urban shrinkage. Two composite indicators were additionally created to measure the extent of urban shrinkage: CSI (Composite Shrinking Index) and RDC (Regional Demographic Change) for two-time intervals. Based on the CSI, three major categories of shrinking were observed: persistent shrinkage, mild shrinking or slow evolution toward shrinking, where the vast majority of towns are found (including mining towns, where there still is a delayed restructuring of state-owned enterprises, and towns characterised by the agrarization of local economies), and stagnant/stabilized shrinkage.
cpsurvsim: An R Package for Simulating Data from Change-Point Hazard Distributions
Change-point hazard models have several practical applications, including modeling processes such as cancer mortality rates and disease progression. While the inverse cumulative distribution function (CDF) method is commonly used for simulating data, we demonstrate the shortcomings of this approach when simulating data from change-point hazard distributions with more than a scale parameter. We propose an alternative method of simulating this data that takes advantage of the memoryless property of survival data and introduce the R package *cpsurvsim* which implements both simulation methods. The functions of *cpsurvsim* are discussed, demonstrated, and compared.
A Computational Analysis of the Dynamics of R Style Based on 108 Million Lines of Code from All CRAN Packages in the Past 21 Years
The flexibility of R and the diversity of the R community leads to a large number of programming styles applied in R packages. We have analyzed 108 million lines of R code from CRAN and quantified the evolution in popularity of 12 style-elements from 1998 to 2019. We attribute 3 main factors that drive changes in programming style: the effect of style-guides, the effect of introducing new features, and the effect of editors. We observe in the data that a consensus in programming style is forming, such as using lower snake case for function names (e.g. softplus_func) and \<- rather than = for assignment.
rmonad: pipelines you can compute on
The [*rmonad*](https://CRAN.R-project.org/package=rmonad) package presents a monadic pipeline toolset for chaining functions into stateful, branching pipelines. As functions in the pipeline are run, their results are merged into a graph of all past operations. The resulting structure allows downstream computation on node documentation, intermediate data, performance stats, and any raised messages, warnings or errors, as well as the final results. [*rmonad*](https://CRAN.R-project.org/package=rmonad) is a novel approach to designing reproducible, well-documented, and maintainable workflows in R.
A Software Tool For Sparse Estimation Of A General Class Of High-dimensional GLMs
Generalized linear models are the workhorse of many inferential problems. Also in the modern era with high-dimensional settings, such models have been proven to be effective exploratory tools. Most attention has been paid to Gaussian, binomial and Poisson settings, which have efficient computational implementations and where either the dispersion parameter is largely irrelevant or absent. However, general GLMs have dispersion parameters $\phi$ that affect the value of the log-likelihood. This in turn, affects the value of various information criteria such as AIC and BIC, and has a considerable impact on the computation and selection of the optimal model. The R-package [*dglars*](https://CRAN.R-project.org/package=dglars) is one of the standard packages to perform high-dimensional analyses for GLMs. Being based on fundamental likelihood considerations, rather than arbitrary penalization, it naturally extends to the general GLM setting. In this paper, we present an improved predictor-corrector (IPC) algorithm for computing the differential geometric least angle regression (dgLARS) solution curve, proposed in [@Augug13] and [@pazira]. We describe the implementation of a stable estimator of the dispersion parameter proposed in [@pazira] for high-dimensional exponential dispersion models. A simulation study is conducted to test the performance of the proposed methods and algorithms. We illustrate the methods using an example. The described improvements have been implemented in a new version of the R-package [*dglars*](https://CRAN.R-project.org/package=dglars).
bayesanova: An R package for Bayesian Inference in the Analysis of Variance via Markov Chain Monte Carlo in Gaussian Mixture Models
This paper introduces the R package [*bayesanova*](https://CRAN.R-project.org/package=bayesanova), which performs Bayesian inference in the analysis of variance (ANOVA). Traditional ANOVA based on null hypothesis significance testing (NHST) is prone to overestimating effects and stating effects if none are present. Bayesian ANOVAs developed so far are based on Bayes factors (BF), which also enforce a hypothesis testing stance. Instead, the Bayesian ANOVA implemented in *bayesanova* focusses on effect size estimation and is based on a Gaussian mixture with known allocations, for which full posterior inference for the component parameters is implemented via Markov-Chain-Monte-Carlo (MCMC). Inference for the difference in means, standard deviations and effect sizes between each of the groups is obtained automatically. Estimation of the parameters instead of hypothesis testing is embraced via the region of practical equivalence (ROPE), and helper functions provide checks of the model assumptions and visualization of the results.
Revisiting Historical Bar Graphics on Epidemics in the Era of R ggplot2
This study is motivated by an article published in a local history magazine on "Pandemics in the History". That article was also motivated by a government report involving several statistical graphics which were drawn by hand in 1938 and used to summarize official statistics on epidemics occurred between the years 1923 and 1937. Due to the aesthetic information design available on these historical graphs, in this study, we would like to investigate how graphical elements of the graphs such as titles, axis lines, axis tick marks, tick mark labels, colors, and data values are presented on these graphics and how to reproduce these historical graphics via well-known data visualization package [*ggplot2*](https://CRAN.R-project.org/package=ggplot2) in our era.
RFpredInterval: An R Package for Prediction Intervals with Random Forests and Boosted Forests
Like many predictive models, random forests provide point predictions for new observations. Besides the point prediction, it is important to quantify the uncertainty in the prediction. Prediction intervals provide information about the reliability of the point predictions. We have developed a comprehensive R package, [*RFpredInterval*](https://CRAN.R-project.org/package=RFpredInterval), that integrates 16 methods to build prediction intervals with random forests and boosted forests. The set of methods implemented in the package includes a new method to build prediction intervals with boosted forests (PIBF) and 15 method variations to produce prediction intervals with random forests, as proposed by [@roy_prediction_2020]. We perform an extensive simulation study and apply real data analyses to compare the performance of the proposed method to ten existing methods for building prediction intervals with random forests. The results show that the proposed method is very competitive and, globally, outperforms competing methods.
etrm: Energy Trading and Risk Management in R
This paper introduces [*etrm*](https://CRAN.R-project.org/package=etrm), an R package with tools for trading and financial risk management in energy markets. Contracts for electric power and natural gas differ from most other commodities due to the fact that physical delivery takes place over a time interval, and not at a specific point in time. There is typically strong seasonality, limited storage and transmission capacity and strong correlation between price and required volume. Such characteristics need to be taken into account when pricing contracts and managing financial risk related to energy procurement. Tools for these task are usually bundled into proprietary Energy Trading Risk Management (ETRM) systems delivered by specialized IT vendors. The [*etrm*](https://CRAN.R-project.org/package=etrm) package offers a transparent solution for building a forward price curve for energy commodities which is consistent with methods widely used in the industry. The user's fundamental market view may be combined with contract price quotes to form a forward curve that replicate current market prices, as described in @ollmar2003analysis and @benth2007extracting. [*etrm*](https://CRAN.R-project.org/package=etrm) also provides implementations of five portfolio insurance trading strategies for energy price risk management. The forward market curve and the energy price hedging strategies are core elements in an ETRM system, which to the best of the author's knowledge has not been previously available in the R ecosystem.
fcaR, Formal Concept Analysis with R
Formal concept analysis (FCA) is a solid mathematical framework to manage information based on logic and lattice theory. It defines two explicit representations of the knowledge present in a dataset as concepts and implications. This paper describes an R package called [*fcaR*](https://CRAN.R-project.org/package=fcaR) that implements FCA's core notions and techniques. Additionally, it implements the extension of FCA to fuzzy datasets and a simplification logic to develop automated reasoning tools. This package is the first to implement FCA techniques in R. Therefore, emphasis has been put on defining classes and methods that could be reusable and extensible by the community. Furthermore, the package incorporates an interface with the [*arules*](https://CRAN.R-project.org/package=arules) package, probably the most used package regarding association rules, closely related to FCA. Finally, we show an application of the use of the package to design a recommender system based on logic for diagnosis in neurological pathologies.
FMM: An R Package for Modeling Rhythmic Patterns in Oscillatory Systems
This paper is dedicated to the R package *FMM* which implements a novel approach to describe rhythmic patterns in oscillatory signals. The frequency modulated (FMM) model is defined as a parametric signal plus a Gaussian noise, where the signal can be described as a single or a sum of waves. The FMM approach is flexible enough to describe a great variety of rhythmic patterns. The *FMM* package includes all required functions to fit and explore single and multi-wave FMM models, as well as a restricted version that allows equality constraints between parameters representing a priori knowledge about the shape to be included. Moreover, the *FMM* package can generate synthetic data and visualize the results of the fitting process. The potential of this methodology is illustrated with examples of such biological oscillations as the circadian rhythm in gene expression, the electrical activity of the heartbeat and the neuronal activity.
The smoots Package in R for Semiparametric Modeling of Trend Stationary Time Series
This paper is an introduction to the new package in R called [*smoots*](https://CRAN.R-project.org/package=smoots) (smoothing time series), developed for data-driven local polynomial smoothing of trend-stationary time series. Functions for data-driven estimation of the first and second derivatives of the trend are also built-in. It is first applied to monthly changes of the global temperature. The quarterly US-GDP series shows that this package can also be well applied to a semiparametric multiplicative component model for non-negative time series via the log-transformation. Furthermore, we introduced a semiparametric Log-GARCH and a semiparametric Log-ACD model, which can be easily estimated by the *smoots* package. Of course, this package applies to suitable time series from any other research area. The *smoots* package also provides a useful tool for teaching time series analysis, because many practical time series follow an additive or a multiplicative component model.
starvars: An R Package for Analysing Nonlinearities in Multivariate Time Series
Although linear autoregressive models are useful to practitioners in different fields, often a nonlinear specification would be more appropriate in time series analysis. In general, there are many alternative approaches to nonlinearity modelling, one consists in assuming multiple regimes. Among the possible specifications that account for regime changes in the multivariate framework, smooth transition models are the most general, since they nest both linear and threshold autoregressive models. This paper introduces the [*starvars*](https://CRAN.R-project.org/package=starvars) package which estimates and predicts the Vector Logistic Smooth Transition model in a very general setting which also includes predetermined variables. In comparison to the existing R packages, *starvars* offers the estimation of the Vector Smooth Transition model both by maximum likelihood and nonlinear least squares. The package allows also to test for nonlinearity in a multivariate setting and detect the presence of common breaks. Furthermore, the package computes multi-step-ahead forecasts. Finally, an illustration with financial time series is provided to show its usage.
Palmer Archipelago Penguins Data in the palmerpenguins R Package - An Alternative to Anderson's Irises
In 1935, Edgar Anderson collected size measurements for 150 flowers from three species of *Iris* on the Gaspé Peninsula in Quebec, Canada. Since then, Anderson's *Iris* observations have become a classic dataset in statistics, machine learning, and data science teaching materials. It is included in the base R datasets package as `iris`, making it easy for users to access without knowing much about it. However, the lack of data documentation, presence of non-intuitive variables (e.g. "sepal width"), and perfectly balanced groups with zero missing values make `iris` an inadequate and stale dataset for teaching and learning modern data science skills. Users would benefit from working with a more representative, real-world environmental dataset with a clear link to current scientific research. Importantly, Anderson’s *Iris* data appeared in a 1936 publication by R. A. Fisher in the *Annals of Eugenics* (which is often the first-listed citation for the dataset), inextricably linking `iris` to eugenics research. Thus, a modern alternative to `iris` is needed. In this paper, we introduce the palmerpenguins R package [@R-palmerpenguins], which includes body size measurements collected from 2007 - 2009 for three species of *Pygoscelis* penguins that breed on islands throughout the Palmer Archipelago, Antarctica. The `penguins` dataset in palmerpenguins provides an approachable, charismatic, and near drop-in replacement for `iris` with topical relevance for polar climate change and environmental impacts on marine predators. Since the release on CRAN in July 2020, the palmerpenguins package has been downloaded over 462,000 times, highlighting the demand and widespread adoption of this viable `iris` alternative. We directly compare the `iris` and `penguins` datasets for selected analyses to demonstrate that R users, in particular teachers and learners currently using `iris`, can switch to the Palmer Archipelago penguins for many use cases including data wrangling, visualization, linear modeling, multivariate analysis (e.g., PCA), cluster analysis and classification (e.g., by k-means).
Advancing Reproducible Research by Publishing R Markdown Notebooks as Interactive Sandboxes Using the learnr Package
Various R packages and best practices have played a pivotal role to promote the Findability, Accessibility, Interoperability, and Reuse (FAIR) principles of open science. For example, (1) well-documented R scripts and notebooks with rich narratives are deposited at a trusted data centre, (2) R Markdown interactive notebooks can be run on-demand as a web service, and (3) R Shiny web apps provide nice user interfaces to explore research outputs. However, notebooks require users to go through the entire analysis, while Shiny apps do not expose the underlying code and require extra work for UI design. We propose using the learnr package to expose certain code chunks in R Markdown so that users can readily experiment with them in guided, editable, isolated, executable, and resettable code sandboxes. Our approach does not replace the existing use of notebooks and Shiny apps, but it adds another level of abstraction between them to promote reproducible science.

RPESE: Risk and Performance Estimators Standard Errors with Serially Dependent Data
The R package [*RPESE*](https://CRAN.R-project.org/package=RPESE) (Risk and Performance Estimators Standard Errors) implements a new method for computing accurate standard errors of risk and performance estimators when returns are serially dependent. The new method makes use of the representation of a risk or performance estimator as a summation of a time series of influence-function (IF) transformed returns, and computes estimator standard errors using a sophisticated method of estimating the spectral density at frequency zero of the time series of IF-transformed returns. Two additional packages used by [*RPESE*](https://CRAN.R-project.org/package=RPESE) are introduced, namely [*RPEIF*](https://CRAN.R-project.org/package=RPEIF) which computes and provides graphical displays of the IF of risk and performance estimators, and [*RPEGLMEN*](https://CRAN.R-project.org/package=RPEGLMEN) which implements a regularized Gamma generalized linear model polynomial fit to the periodogram of the time series of the IF-transformed returns. A Monte Carlo study shows that the new method provides more accurate estimates of standard errors for risk and performance estimators compared to well-known alternative methods in the presence of serial correlation.
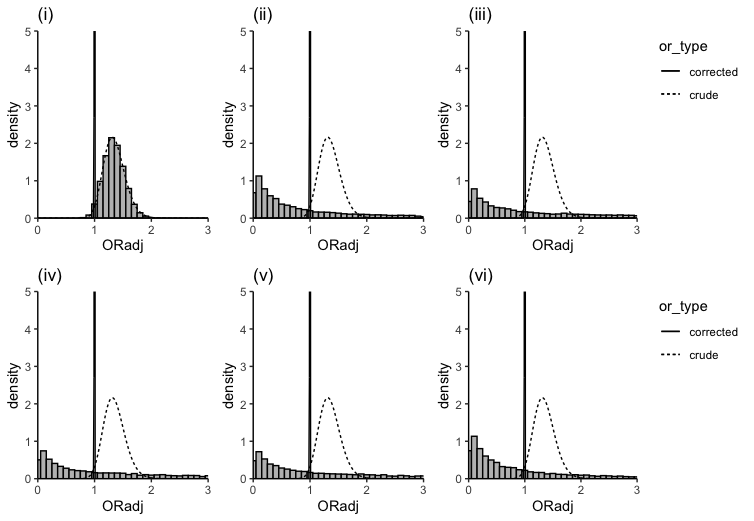
BayesSenMC: an R package for Bayesian Sensitivity Analysis of Misclassification
In case--control studies, the odds ratio is commonly used to summarize the association between a binary exposure and a dichotomous outcome. However, exposure misclassification frequently appears in case--control studies due to inaccurate data reporting, which can produce bias in measures of association. In this article, we implement a Bayesian sensitivity analysis of misclassification to provide a full posterior inference on the corrected odds ratio under both non-differential and differential misclassification. We present an [R]{.sans-serif} [@R] package [*BayesSenMC*](https://CRAN.R-project.org/package=BayesSenMC), which provides user-friendly functions for its implementation. The usage is illustrated by a real data analysis on the association between bipolar disorder and rheumatoid arthritis.
EMSS: New EM-type algorithms for the Heckman selection model in R
When investigators observe non-random samples from populations, sample selectivity problems may occur. The Heckman selection model is widely used to deal with selectivity problems. Based on the EM algorithm, [@Zhaoetal:2020] developed three algorithms, namely, ECM, ECM(NR), and ECME(NR), which also have the EM algorithm's main advantages: stability and ease of implementation. This paper provides the implementation of these three new EM-type algorithms in the package *EMSS* and illustrates the usage of the package on several simulated and real data examples. The comparison between the maximum likelihood estimation method (MLE) and three new EM-type algorithms in robustness issues is further discussed.

Analysis of Corneal Data in R with the rPACI Package
In ophthalmology, the early detection of keratoconus is still a crucial problem. Placido disk corneal topographers are essential in clinical practice, and many indices for diagnosing corneal irregularities exist. The main goal of this work is to present the R package *rPACI*, providing several functions to handle and analyze corneal data. This package implements primary indices of corneal irregularity (based on geometrical properties) and compound indices built from the primary ones, either using a generalized linear model or as a Bayesian classifier using a hybrid Bayesian network and performing approximate inference. *rPACI* aims to make the analysis of corneal data accessible for practitioners and researchers in the field. Moreover, a *shiny* app was developed to use *rPACI* in any web browser in a truly user-friendly graphical interface without installing R or writing any R code. It is openly deployed at <https://admaldonado.shinyapps.io/rPACI/>.

DRHotNet: An R package for detecting differential risk hotspots on a linear network
One of the most common applications of spatial data analysis is detecting zones, at a certain scale, where a point-referenced event under study is especially concentrated. The detection of such zones, which are usually referred to as hotspots, is essential in certain fields such as criminology, epidemiology, or traffic safety. Traditionally, hotspot detection procedures have been developed over areal units of analysis. Although working at this spatial scale can be suitable enough for many research or practical purposes, detecting hotspots at a more accurate level (for instance, at the road segment level) may be more convenient sometimes. Furthermore, it is typical that hotspot detection procedures are entirely focused on the determination of zones where an event is (overall) highly concentrated. It is less common, by far, that such procedures focus on detecting zones where a specific type of event is overrepresented in comparison with the other types observed, which have been denoted as differential risk hotspots. The R package *DRHotNet* provides several functionalities to facilitate the detection of differential risk hotspots within a linear network. In this paper, *DRHotNet* is depicted, and its usage in the R console is shown through a detailed analysis of a crime dataset.
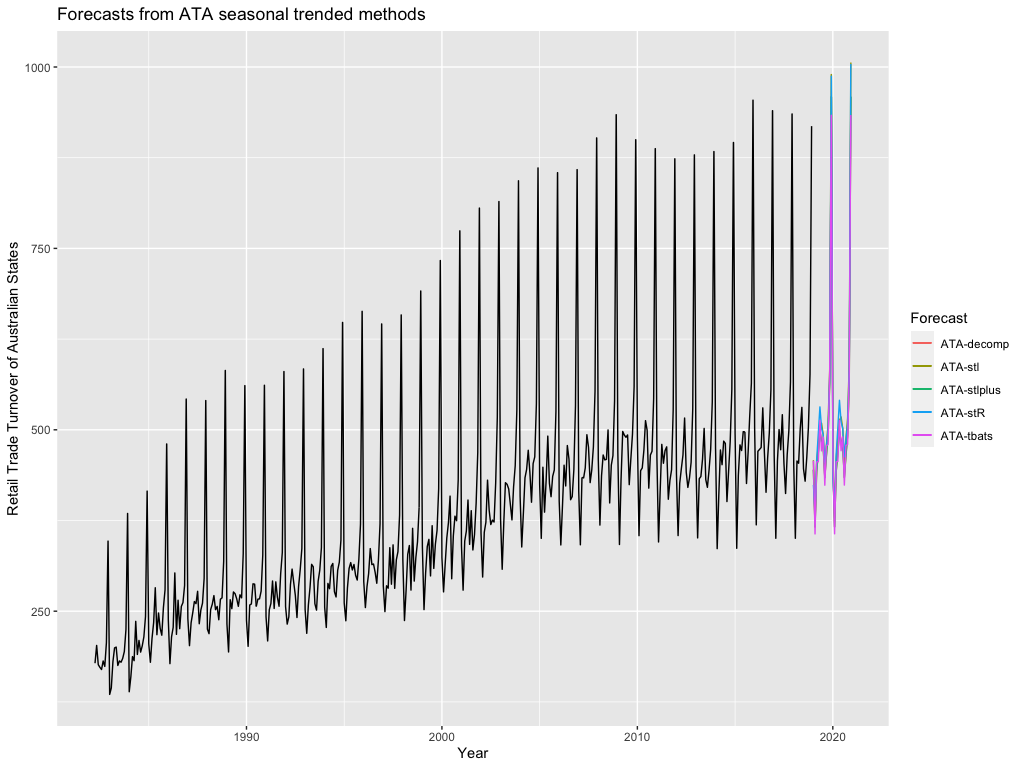
Automatic Time Series Forecasting with Ata Method in R: ATAforecasting Package
Ata method is a new univariate time series forecasting method that provides innovative solutions to issues faced during the initialization and optimization stages of existing methods. The Ata method's forecasting performance is superior to existing methods in terms of easy implementation and accurate forecasting. It can be applied to non-seasonal or deseasonalized time series, where the deseasonalization can be performed via any preferred decomposition method. The R package [*ATAforecasting*](https://CRAN.R-project.org/package=ATAforecasting) was developed as a comprehensive toolkit for automatic time series forecasting. It focuses on modeling all types of time series components with any preferred Ata methods and handling seasonality patterns by utilizing some popular decomposition techniques. The *ATAforecasting* package allows researchers to model seasonality with STL, STLplus, TBATS, stR, and TRAMO/SEATS, and power family transformation and analyze the any time series with a simple Ata method and additive, multiplicative, damped trend the Ata methods and level fixed Ata trended methods. It offers functions for researchers and data analysts to model any type of time series data sets without requiring specialization. However, an expert user may use the functions that can model all possible time series behaviors. The package also incorporates types of model specifications and their graphs, uses different accuracy measures that surely increase the Ata method's performance.

spNetwork: A Package for Network Kernel Density Estimation
This paper introduces the new package [*spNetwork*](https://CRAN.R-project.org/package=spNetwork) that provides functions to perform Network Kernel Density Estimate analysis (NKDE). This method is an extension of the classical Kernel Density Estimate (KDE), a non parametric approach to estimate the intensity of a spatial process. More specifically, it adapts the KDE for cases when the study area is a network, constraining the location of events (such as accidents on roads, leaks in pipes, fish in rivers, etc.). We present and discuss in this paper the three main versions of NKDE: simple, discontinuous, and continuous that are implemented in [*spNetwork*](https://CRAN.R-project.org/package=spNetwork). We illustrate how to apply the three methods and map their results using a sample from a real dataset representing bike accidents in a central neighborhood of Montreal. We also describe the optimization techniques used to reduce calculation time and investigate their impacts when applying the three NKDE to a city-wide dataset.
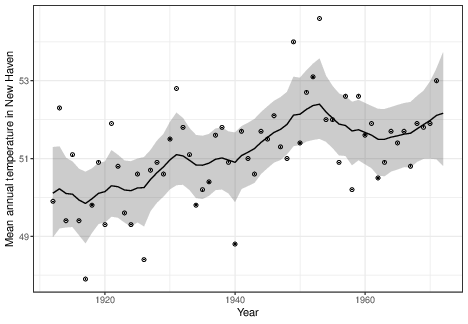
bssm: Bayesian Inference of Non-linear and Non-Gaussian State Space Models in R
We present an R package [*bssm*](https://CRAN.R-project.org/package=bssm) for Bayesian non-linear/non-Gaussian state space modeling. Unlike the existing packages, *bssm* allows for easy-to-use approximate inference based on Gaussian approximations such as the Laplace approximation and the extended Kalman filter. The package also accommodates discretely observed latent diffusion processes. The inference is based on fully automatic, adaptive Markov chain Monte Carlo (MCMC) on the hyperparameters, with optional importance sampling post-correction to eliminate any approximation bias. The package also implements a direct pseudo-marginal MCMC and a delayed acceptance pseudo-marginal MCMC using intermediate approximations. The package offers an easy-to-use interface to define models with linear-Gaussian state dynamics with non-Gaussian observation models and has an [*Rcpp*](https://CRAN.R-project.org/package=Rcpp) interface for specifying custom non-linear and diffusion models.
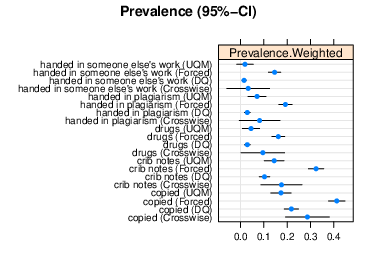
Generalized Linear Randomized Response Modeling using GLMMRR
Randomized response (RR) designs are used to collect response data about sensitive behaviors (e.g., criminal behavior, sexual desires). The modeling of RR data is more complex since it requires a description of the RR process. For the class of generalized linear mixed models (GLMMs), the RR process can be represented by an adjusted link function, which relates the expected RR to the linear predictor for most common RR designs. The package *GLMMRR* includes modified link functions for four different cumulative distributions (i.e., logistic, cumulative normal, Gumbel, Cauchy) for GLMs and GLMMs, where the package *lme4* facilitates ML and REML estimation. The mixed modeling framework in *GLMMRR* can be used to jointly analyze data collected under different designs (e.g., dual questioning, multilevel, mixed mode, repeated measurements designs, multiple-group designs). Model-fit tests, tools for residual analyses, and plot functions to give support to a profound RR data analysis are added to the well-known features of the GLM and GLMM software (package *lme4*). Data of and Jann (2018) and Jann, and Diekmann (2014) are used to illustrate the methodology and software.

Visual Diagnostics for Constrained Optimisation with Application to Guided Tours
A guided tour helps to visualise high-dimensional data by showing low-dimensional projections along a projection pursuit optimisation path. Projection pursuit is a generalisation of principal component analysis in the sense that different indexes are used to define the interestingness of the projected data. While much work has been done in developing new indexes in the literature, less has been done on understanding the optimisation. Index functions can be noisy, might have multiple local maxima as well as an optimal maximum, and are constrained to generate orthonormal projection frames, which complicates the optimization. In addition, projection pursuit is primarily used for exploratory data analysis, and finding the local maxima is also useful. The guided tour is especially useful for exploration because it conducts geodesic interpolation connecting steps in the optimisation and shows how the projected data changes as a maxima is approached. This work provides new visual diagnostics for examining a choice of optimisation procedure based on the provision of a new data object which collects information throughout the optimisation. It has helped to diagnose and fix several problems with projection pursuit guided tour. This work might be useful more broadly for diagnosing optimisers and comparing their performance. The diagnostics are implemented in the R package [ferrn](https://github.com/huizezhang-sherry/ferrn).
RobustBF: An R Package for Robust Solution to the Behrens-Fisher Problem
Welch's two-sample $t$-test based on least squares (LS) estimators is generally used to test the equality of two normal means when the variances are not equal. However, this test loses its power when the underlying distribution is not normal. In this paper, two different tests are proposed to test the equality of two long-tailed symmetric (LTS) means under heterogeneous variances. Adaptive modified maximum likelihood (AMML) estimators are used in developing the proposed tests since they are highly efficient under LTS distribution. An R package called [*RobustBF*](https://CRAN.R-project.org/package=RobustBF) is given to show the implementation of these tests. Simulated Type I error rates and powers of the proposed tests are also given and compared with Welch's $t$-test based on LS estimators via an extensive Monte Carlo simulation study.
Software Engineering and R Programming: A Call for Research
Although R programming has been a part of research since its origins in the 1990s, few studies address scientific software development from a Software Engineering (SE) perspective. The past few years have seen unparalleled growth in the R community, and it is time to push the boundaries of SE research and R programming forwards. This paper discusses relevant studies that close this gap Additionally, it proposes a set of good practices derived from those findings aiming to act as a call-to-arms for both the R and RSE (Research SE) community to explore specific, interdisciplinary paths of research.
We Need Trustworthy R Packages
There is a need for rigorous software engineering in R packages, and there is a need for new research to bridge scientific computing with more traditional computing. Automated tools, interdisciplinary graduate courses, code reviews, and a welcoming developer community will continue to democratize best practices. Democratized software engineering will improve the quality, correctness, and integrity of scientific software, and by extension, the disciplines that rely on it.
The R Developer Community Does Have a Strong Software Engineering Culture
There is a strong software engineering culture in the R developer community. We recommend creating, updating and vetting packages as well as keeping up with community standards. We invite contributions to the rOpenSci project, where participants can gain experience that will shape their work and that of their peers.
The R Quest: from Users to Developers
R is not a programming language, and this produces the inherent dichotomy between analytics and software engineering. With the emergence of data science, the opportunity exists to bridge this gap, especially through teaching practices.
Rejoinder: Software Engineering and R Programming
It is a pleasure to take part in such fruitful discussion about the relationship between Software Engineering and R programming, and what could be gain by allowing each to look more closely at the other. Several discussants make valuable arguments that ought to be further discussed.
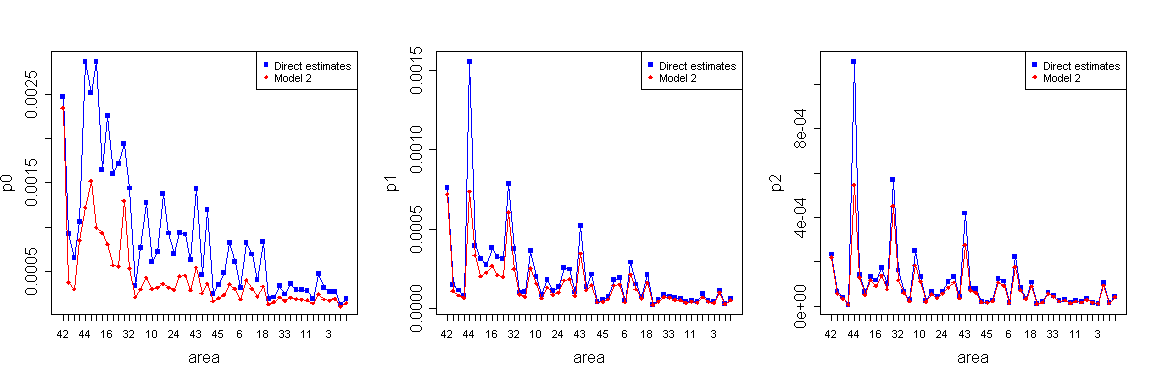
msae: An R Package of Multivariate Fay-Herriot Models for Small Area Estimation
The paper introduces an R Package of multivariate Fay-Herriot models for small area estimation named *msae*. This package implements four types of Fay-Herriot models, including univariate Fay-Herriot model (model 0), multivariate Fay-Herriot model (model 1), autoregressive multivariate Fay-Herriot model (model 2), and heteroskedastic autoregressive multivariate Fay-Herriot model (model 3). It also contains some datasets generated based on multivariate Fay-Herriot models. We describe and implement functions through various practical examples. Multivariate Fay-Herriot models produce a more efficient parameter estimation than direct estimation and univariate model.
A Unifying Framework for Parallel and Distributed Processing in R using Futures
A future is a programming construct designed for concurrent and asynchronous evaluation of code, making it particularly useful for parallel processing. The *future* package implements the Future API for programming with futures in R. This minimal API provides sufficient constructs for implementing parallel versions of well-established, high-level map-reduce APIs. The future ecosystem supports exception handling, output and condition relaying, parallel random number generation, and automatic identification of globals lowering the threshold to parallelize code. The Future API bridges parallel frontends with parallel backends, following the philosophy that end-users are the ones who choose the parallel backend while the developer focuses on what to parallelize. A variety of backends exist, and third-party contributions meeting the specifications, which ensure that the same code works on all backends, are automatically supported. The future framework solves several problems not addressed by other parallel frameworks in R.
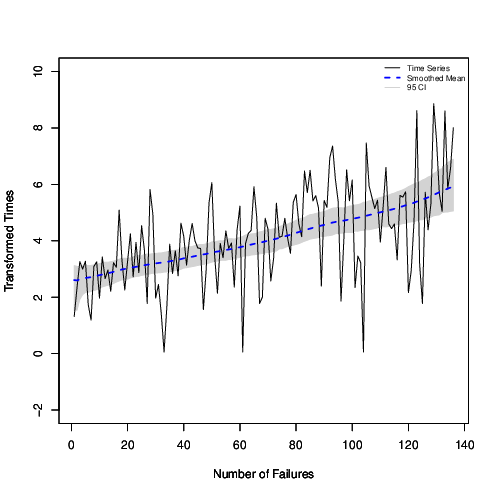
NGSSEML: Non-Gaussian State Space with Exact Marginal Likelihood
The number of packages/software for Gaussian State Space models has increased over recent decades. However, there are very few codes available for non-Gaussian State Space (NGSS) models due to analytical intractability that prevents exact calculations. One of the few tractable exceptions is the family of NGSS with exact marginal likelihood, named NGSSEML. In this work, we present the wide range of data formats and distributions handled by NGSSEML and a package in the R language to perform classical and Bayesian inference for them. Special functions for filtering, forecasting, and smoothing procedures and the exact calculation of the marginal likelihood function are provided. The methods implemented in the package are illustrated for count and volatility time series and some reliability/survival models, showing that the codes are easy to handle. Therefore, the NGSSEML family emerges as a simple and interesting option/alternative for modeling non-Gaussian time-varying structures commonly encountered in time series and reliability/survival studies.\ **Keywords**: Bayesian, classical inference, reliability, smoothing, time series, software R
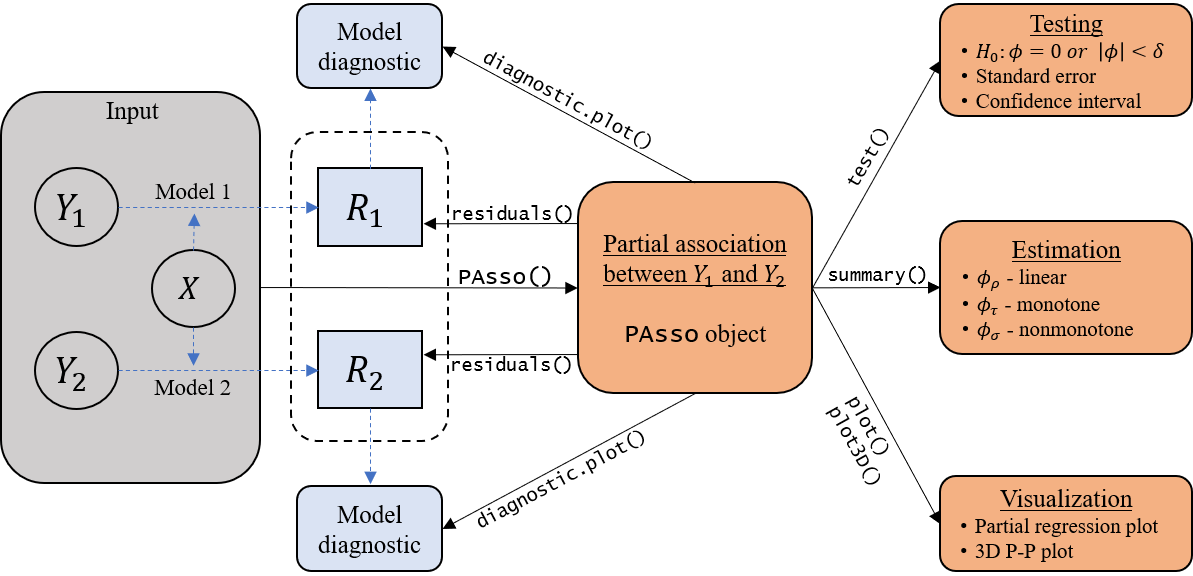
PAsso: an R Package for Assessing Partial Association between Ordinal Variables
Partial association, the dependency between variables after adjusting for a set of covariates, is an important statistical notion for scientific research. However, if the variables of interest are ordered categorical data, the development of statistical methods and software for assessing their partial association is limited. Following the framework established by @liu2020jasa, we develop an R package [*PAsso*](https://CRAN.R-project.org/package=PAsso) for assessing **P**artial **Asso**ciations between ordinal variables. The package provides various functions that allow users to perform a wide spectrum of assessments, including quantification, visualization, and hypothesis testing. In this paper, we discuss the implementation of *PAsso* in detail and demonstrate its utility through an analysis of the 2016 American National Election Study.

Robust and Efficient Optimization Using a Marquardt-Levenberg Algorithm with R Package marqLevAlg
Implementations in R of classical general-purpose algorithms for local optimization generally have two major limitations which cause difficulties in applications to complex problems: too loose convergence criteria and too long calculation time. By relying on a Marquardt-Levenberg algorithm (MLA), a Newton-like method particularly robust for solving local optimization problems, we provide with marqLevAlg package an efficient and general-purpose local optimizer which (i) prevents convergence to saddle points by using a stringent convergence criterion based on the relative distance to minimum/maximum in addition to the stability of the parameters and of the objective function; and (ii) reduces the computation time in complex settings by allowing parallel calculations at each iteration. We demonstrate through a variety of cases from the literature that our implementation reliably and consistently reaches the optimum (even when other optimizers fail) and also largely reduces computational time in complex settings through the example of maximum likelihood estimation of different sophisticated statistical models.
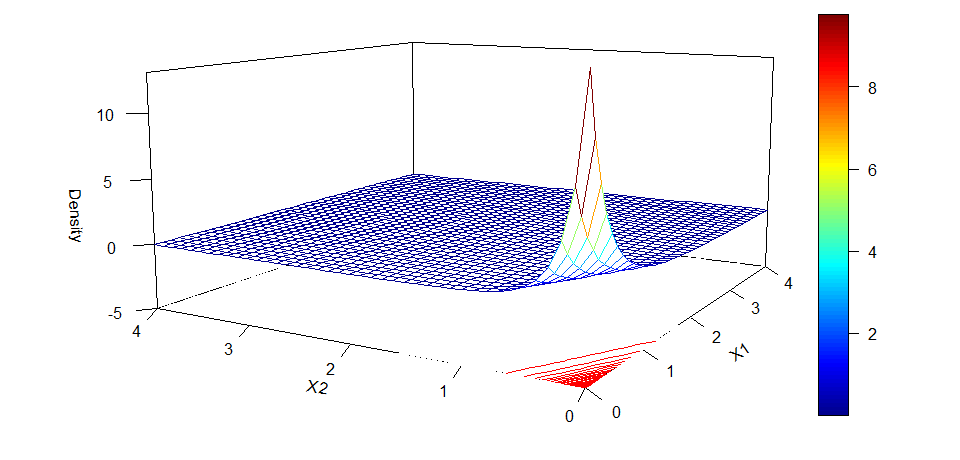
An R package for Non-Normal Multivariate Distributions: Simulation and Probability Calculations from Multivariate Lomax (Pareto Type II) and Other Related Distributions
Convenient and easy-to-use programs are readily available in R to simulate data from and probability calculations for several common multivariate distributions such as normal and $t$. However, functions for doing so from other less common multivariate distributions, especially those which are asymmetric, are not as readily available, either in R or otherwise. We introduce the R package *NonNorMvtDist* to generate random numbers from multivariate Lomax distribution, which constitutes a very flexible family of skewed multivariate distributions. Further, by applying certain useful properties of multivariate Lomax distribution, multivariate cases of generalized Lomax, Mardia's Pareto of Type I, Logistic, Burr, Cook-Johnson's uniform, $F$, and inverted beta can be also considered, and random numbers from these distributions can be generated. Methods for the probability and the equicoordinate quantile calculations for all these distributions are then provided. This work substantially enriches the existing R toolbox for nonnormal or nonsymmetric multivariate probability distributions.
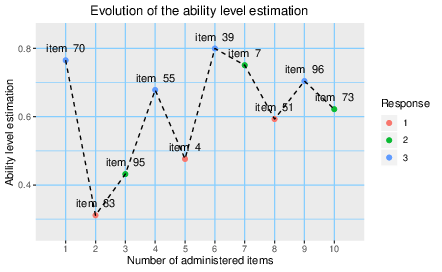
cat.dt: An R package for fast construction of accurate Computerized Adaptive Tests using Decision Trees
This article introduces the *cat.dt* package for the creation of Computerized Adaptive Tests (CATs). Unlike existing packages, the *cat.dt* package represents the CAT in a Decision Tree (DT) structure. This allows building the test before its administration, ensuring that the creation time of the test is independent of the number of participants. Moreover, to accelerate the construction of the tree, the package controls its growth by joining nodes with similar estimations or distributions of the ability level and uses techniques such as message passing and pre-calculations. The constructed tree, as well as the estimation procedure, can be visualized using the graphical tools included in the package. An experiment designed to evaluate its performance shows that the *cat.dt* package drastically reduces computational time in the creation of CATs without compromising accuracy.
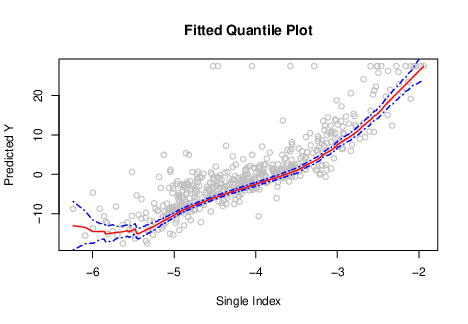
SIQR: An R Package for Single-index Quantile Regression
We develop an R package *SIQR* that implements the single-index quantile regression (SIQR) models via an efficient iterative local linear approach in [@wu_single-index_2010]. Single-index quantile regression models are important tools in semiparametric regression to provide a comprehensive view of the conditional distributions of a response variable. It is especially useful when the data is heterogeneous or heavy-tailed. The package provides functions that allow users to fit SIQR models, predict, provide standard errors of the single-index coefficients via bootstrap, and visualize the estimated univariate function. We apply the R package *SIQR* to a well-known Boston Housing data.

mgee2: An R package for marginal analysis of longitudinal ordinal data with misclassified responses and covariates
Marginal methods have been widely used for analyzing longitudinal ordinal data due to their simplicity in model assumptions, robustness in inference results, and easiness in the implementation. However, they are often inapplicable in the presence of measurement errors in the variables. Under the setup of longitudinal studies with ordinal responses and covariates subject to misclassification, @Chen2013 developed marginal methods for misclassification adjustments using the second-order estimating equations and proposed a two-stage estimation approach when the validation subsample is available. Parameter estimation is conducted through the Newton-Raphson algorithm, and the asymptotic distribution of the estimators is established. While the methods of @Chen2013 can successfully correct the misclassification effects, its implementation is not accessible to general users due to the lack of a software package. In this paper, we develop an R package, [*mgee2*](https://CRAN.R-project.org/package=mgee2), to implement the marginal methods proposed by @Chen2013. To evaluate the performance and illustrate the features of the package, we conduct numerical studies.
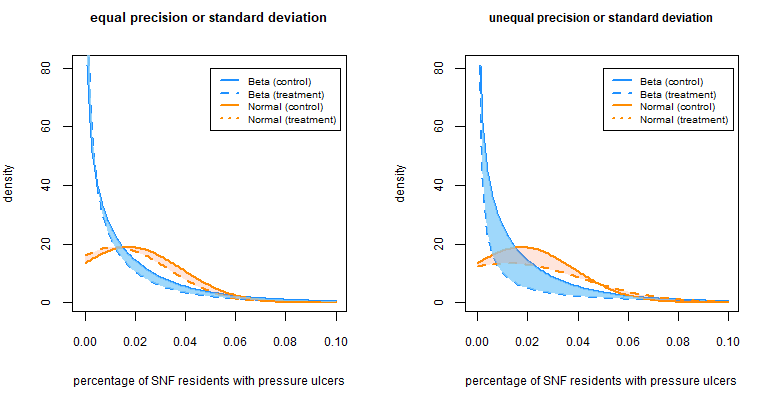
PASSED: Calculate Power and Sample Size for Two Sample Tests
Power and sample size estimation are critical aspects of study design to demonstrate minimized risk for subjects and justify the allocation of time, money, and other resources. Researchers often work with response variables that take the form of various distributions. Here, we present an R package, [*PASSED*](https://CRAN.R-project.org/package=PASSED), that allows flexibility with seven common distributions and multiple options to accommodate sample size or power analysis. The relevant statistical theory, calculations, and examples for each distribution using *PASSED* are discussed in this paper.
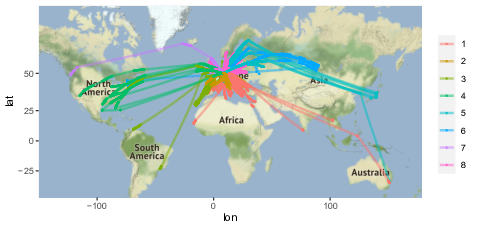
openSkies - Integration of Aviation Data into the R Ecosystem
Aviation data has become increasingly more accessible to the public thanks to the adoption of technologies such as Automatic Dependent Surveillance-Broadcast (ADS-B) and Mode S, which provide aircraft information over publicly accessible radio channels. Furthermore, the OpenSky Network provides multiple public resources to access such air traffic data from a large network of ADS-B receivers. Here, we present *openSkies*, the first R package for processing public air traffic data. The package provides an interface to the OpenSky Network resources, standardized data structures to represent the different entities involved in air traffic data, and functionalities to analyze and visualize such data. Furthermore, the portability of the implemented data structures makes *openSkies* easily reusable by other packages, therefore laying the foundation of aviation data engineering in R.

lg: An R package for Local Gaussian Approximations
The package [*lg*](https://CRAN.R-project.org/package=lg) for the R programming language provides implementations of recent methodological advances on applications of the local Gaussian correlation. This includes the estimation of the local Gaussian correlation itself, multivariate density estimation, conditional density estimation, various tests for independence and conditional independence, as well as a graphical module for creating dependence maps. This paper describes the [*lg*](https://CRAN.R-project.org/package=lg) package, its principles, and its practical use.
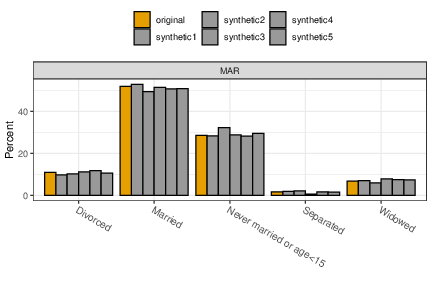
Multiple Imputation and Synthetic Data Generation with NPBayesImputeCat
In many contexts, missing data and disclosure control are ubiquitous and challenging issues. In particular, at statistical agencies, the respondent-level data they collect from surveys and censuses can suffer from high rates of missingness. Furthermore, agencies are obliged to protect respondents' privacy when publishing the collected data for public use. The [*NPBayesImputeCat*](https://CRAN.R-project.org/package=NPBayesImputeCat) R package, introduced in this paper, provides routines to i) create multiple imputations for missing data and ii) create synthetic data for statistical disclosure control, for multivariate categorical data, with or without structural zeros. We describe the Dirichlet process mixture of products of the multinomial distributions model used in the package and illustrate various uses of the package using data samples from the American Community Survey (ACS). We also compare results of the missing data imputation to the [*mice*](https://CRAN.R-project.org/package=mice) R package and those of the synthetic data generation to the [*synthpop*](https://CRAN.R-project.org/package=synthpop) R package.
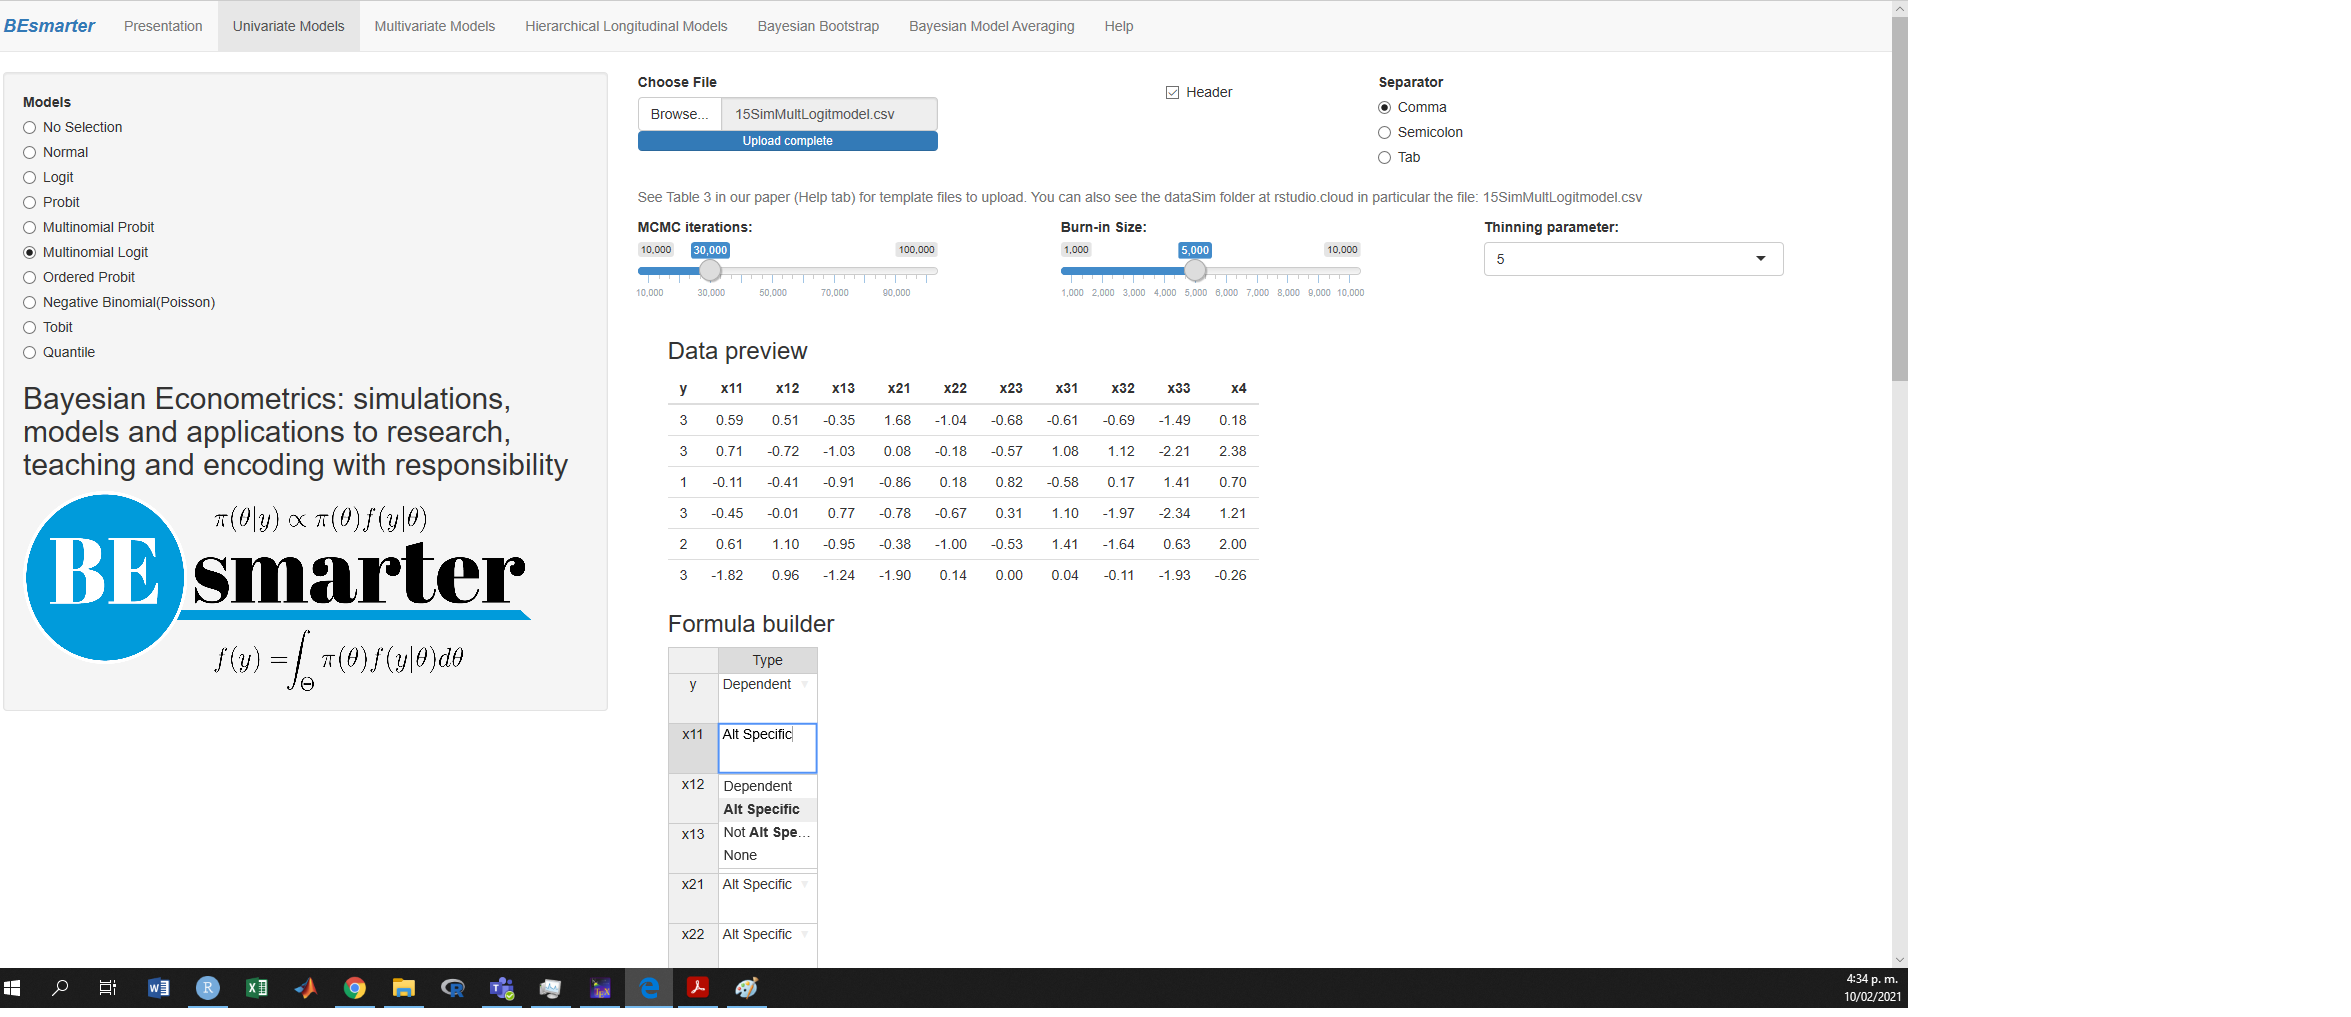
A GUIded tour of Bayesian regression
This paper presents a Graphical User Interface (GUI) to carry out a Bayesian regression analysis in a very friendly environment without any programming skills (drag and drop). This paper is designed for teaching and applied purposes at an introductory level. Our GUI is based on an interactive web application using shiny and libraries from R. We carry out some applications to highlight the potential of our GUI for applied researchers and practitioners. In addition, the Help option in the main tap panel has an extended version of this paper, where we present the basic theory underlying all regression models that we developed in our GUI and more applications associated with each model.
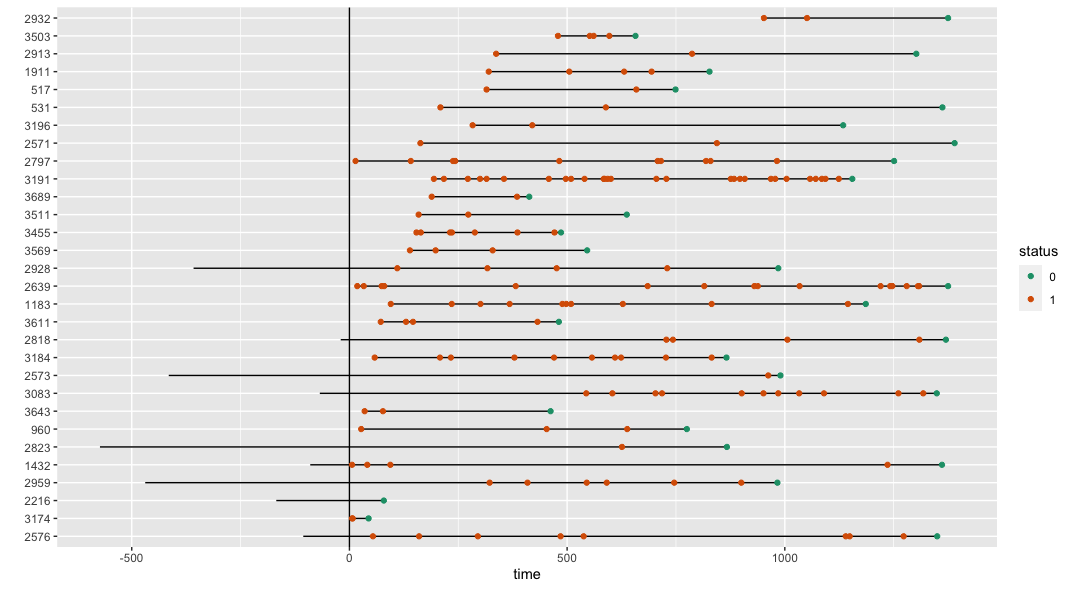
miRecSurv Package: Prentice-Williams-Peterson Models with Multiple Imputation of Unknown Number of Previous Episodes
Left censoring can occur with relative frequency when analyzing recurrent events in epidemiological studies, especially observational ones. Concretely, the inclusion of individuals that were already at risk before the effective initiation in a cohort study may cause the unawareness of prior episodes that have already been experienced, and this will easily lead to biased and inefficient estimates. The [*miRecSurv*](https://CRAN.R-project.org/package=miRecSurv) package is based on the use of models with specific baseline hazard, with multiple imputation of the number of prior episodes when unknown by means of the COMPoisson distribution, a very flexible count distribution that can handle over, sub, and equidispersion, with a stratified model depending on whether the individual had or had not previously been at risk, and the use of a frailty term. The usage of the package is illustrated by means of a real data example based on an occupational cohort study and a simulation study.
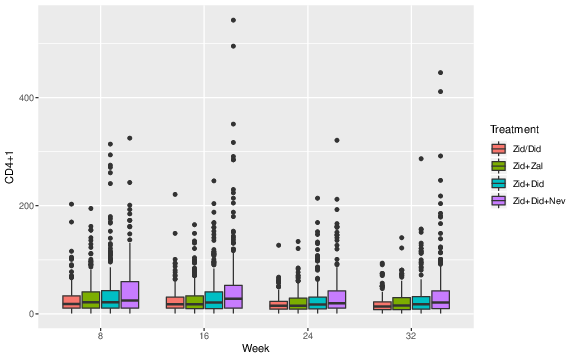
bcmixed: A Package for Median Inference on Longitudinal Data with the Box--Cox Transformation
This article illustrates the use of the [*bcmixed*](https://CRAN.R-project.org/package=bcmixed) package and focuses on the two main functions: `bcmarg` and `bcmmrm`. The `bcmarg` function provides inference results for a marginal model of a mixed effect model using the Box--Cox transformation. The `bcmmrm` function provides model median inferences based on the mixed effect models for repeated measures analysis using the Box--Cox transformation for longitudinal randomized clinical trials. Using the `bcmmrm` function, analysis results with high power and high interpretability for treatment effects can be obtained for longitudinal randomized clinical trials with skewed outcomes. Further, the *bcmixed* package provides summarizing and visualization tools, which would be helpful to write clinical trial reports.
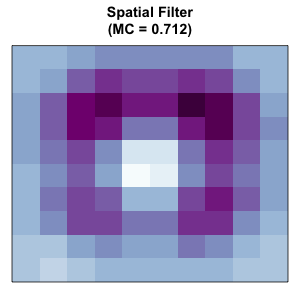
spfilteR: An R package for Semiparametric Spatial Filtering with Eigenvectors in (Generalized) Linear Models
Eigenvector-based Spatial filtering constitutes a highly flexible semiparametric approach to account for spatial autocorrelation in a regression framework. It combines judiciously selected eigenvectors from a transformed connectivity matrix to construct a synthetic spatial filter and remove spatial patterns from model residuals. This article introduces the [*spfilteR*](https://CRAN.R-project.org/package=spfilteR) package that provides several useful and flexible tools to estimate spatially filtered linear and generalized linear models in R. While the package features functions to identify relevant eigenvectors based on different selection criteria in an unsupervised fashion, it also helps users to perform supervised spatial filtering and to select eigenvectors based on alternative user-defined criteria. Besides a brief discussion of the eigenvector-based spatial filtering approach, this article presents the main functions of the package and illustrates their usage. Comparison to alternative implementations in other R packages highlights the added value of the *spfilteR* package.

The vote Package: Single Transferable Vote and Other Electoral Systems in R
We describe the [*vote*](https://CRAN.R-project.org/package=vote) package in R, which implements the plurality (or first-past-the-post), two-round runoff, score, approval, and Single Transferable Vote (STV) electoral systems, as well as methods for selecting the Condorcet winner and loser. We emphasize the STV system, which we have found to work well in practice for multi-winner elections with small electorates, such as committee and council elections, and the selection of multiple job candidates. For single-winner elections, STV is also called Instant Runoff Voting (IRV), Ranked Choice Voting (RCV), or the alternative vote (AV) system. The package also implements the STV system with equal preferences, for the first time in a software package, to our knowledge. It also implements a new variant of STV, in which a minimum number of candidates from a specified group are required to be elected. We illustrate the package with several real examples.

Estimating Social Influence Effects in Networks Using A Latent Space Adjusted Approach in R
Social influence effects have been extensively studied in various empirical network research. However, many challenges remain in estimating social influence effects in networks, as influence effects are often entangled with other factors, such as homophily in the selection process and the common social-environmental factors that individuals are embedded in. Methods currently available either do not solve these problems or require stringent assumptions. Recent works by Xu (2018) and others have shown that a latent space adjusted approach based on the latent space model has the potential to disentangle the influence effects from other processes, and the simulation evidence has shown that this approach outperforms other state-of-the-art approaches in terms of recovering the true social influence effect when there is an unobserved trait co-determining influence and selection. In this paper, I will further illustrate how the latent space adjusted approach can account for bias in the estimation of social influence effects and how this approach can be easily implemented in R.

survidm: An R package for Inference and Prediction in an Illness-Death Model
Multi-state models are a useful way of describing a process in which an individual moves through a number of finite states in continuous time. The illness-death model plays a central role in the theory and practice of these models, describing the dynamics of healthy subjects who may move to an intermediate \"diseased\" state before entering into a terminal absorbing state. In these models, one important goal is the modeling of transition rates which is usually done by studying the relationship between covariates and disease evolution. However, biomedical researchers are also interested in reporting other interpretable results in a simple and summarized manner. These include estimates of predictive probabilities, such as the transition probabilities, occupation probabilities, cumulative incidence functions, and the sojourn time distributions. The development of [*survidm*](https://CRAN.R-project.org/package=survidm) package has been motivated by recent contribution that provides answers to all these topics. An illustration of the software usage is included using real data.
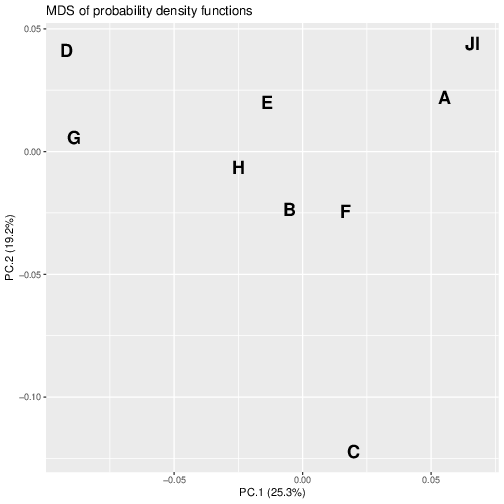
dad: an R Package for Visualisation, Classification and Discrimination of Multivariate Groups Modelled by their Densities
Multidimensional scaling (MDS), hierarchical cluster analysis (HCA), and discriminant analysis (DA) are classical techniques which deal with data made of $n$ individuals and $p$ variables. When the individuals are divided into $T$ groups, the R package *dad* associates with each group a multivariate probability density function and then carries out these techniques on the densities, which are estimated by the data under consideration. These techniques are based on distance measures between densities: chi-square, Hellinger, Jeffreys, Jensen-Shannon, and $L^p$ for discrete densities, Hellinger , Jeffreys, $L^2$, and 2-Wasserstein for Gaussian densities, and $L^2$ for numeric non-Gaussian densities estimated by the Gaussian kernel method. Practical methods help the user to give meaning to the outputs in the context of MDS and HCA and to look for an optimal prediction in the context of DA based on the one-leave-out misclassification ratio. Some functions for data management or basic statistics calculations on groups are annexed.
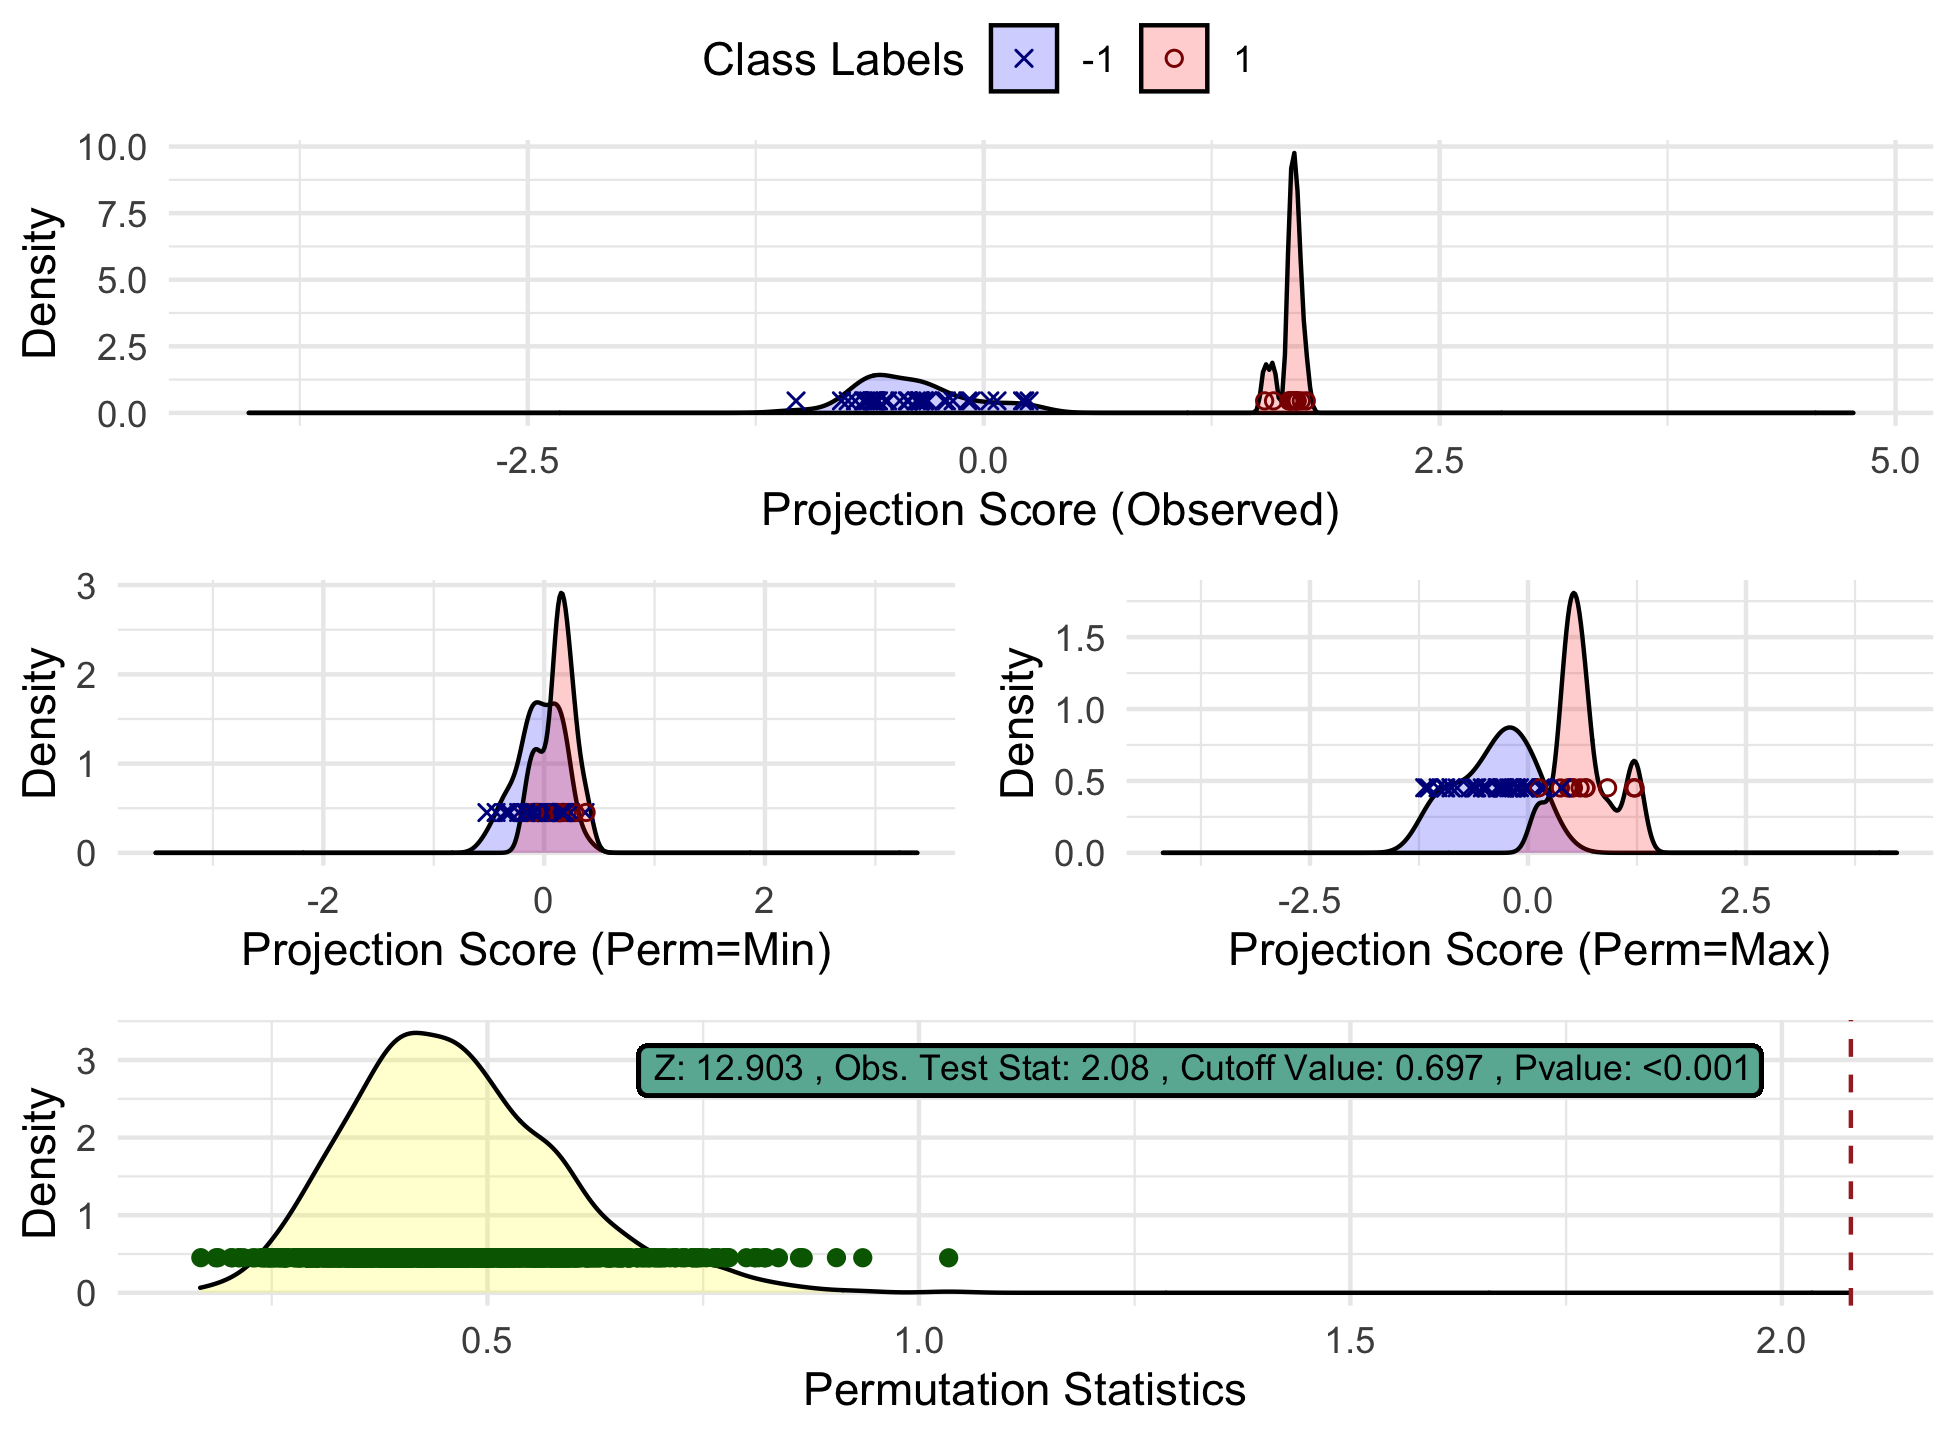
diproperm: An R Package for the DiProPerm Test
High-dimensional low sample size (HDLSS) data sets frequently emerge in many biomedical applications. The direction-projection-permutation (DiProPerm) test is a two-sample hypothesis test for comparing two high-dimensional distributions. The DiProPerm test is exact, i.e., the type I error is guaranteed to be controlled at the nominal level for any sample size, and thus is applicable in the HDLSS setting. This paper discusses the key components of the DiProPerm test, introduces the [*diproperm*](https://CRAN.R-project.org/package=diproperm) R package, and demonstrates the package on a real-world data set.

MatchThem:: Matching and Weighting after Multiple Imputation
Balancing the distributions of the confounders across the exposure levels in an observational study through matching or weighting is an accepted method to control for confounding due to these variables when estimating the association between an exposure and outcome and reducing the degree of dependence on certain modeling assumptions. Despite the increasing popularity in practice, these procedures cannot be immediately applied to datasets with missing values. Multiple imputation of the missing data is a popular approach to account for missing values while preserving the number of units in the dataset and accounting for the uncertainty in the missing values. However, to the best of our knowledge, there is no comprehensive matching and weighting software that can be easily implemented with multiply imputed datasets. In this paper, we review this problem and suggest a framework to map out the matching and weighting of multiply imputed datasets to 5 actions as well as the best practices to assess balance in these datasets after matching and weighting. We also illustrate these approaches using a companion package for R, *MatchThem*.
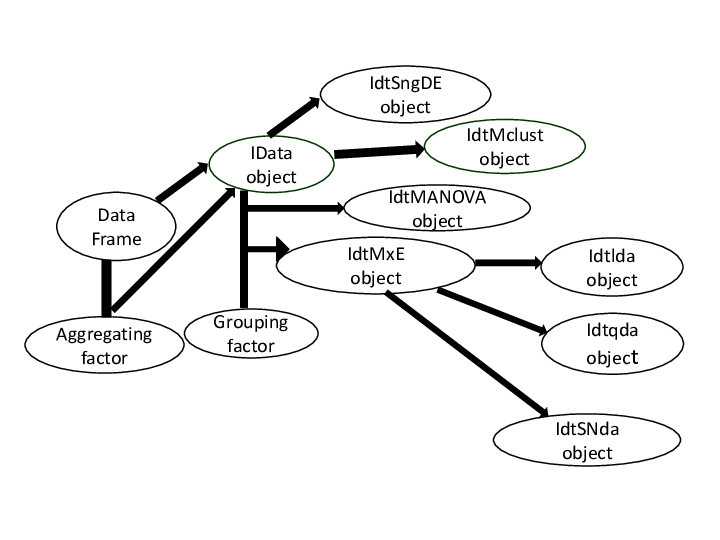
MAINT.Data: Modelling and Analysing Interval Data in R
We present the CRAN R package *MAINT.Data* for the modelling and analysis of multivariate interval data, i.e., where units are described by variables whose values are intervals of $I\!\! R$, representing intrinsic variability. Parametric inference methodologies based on probabilistic models for interval variables have been developed, where each interval is represented by its midpoint and log-range, for which multivariate Normal and Skew-Normal distributions are assumed. The intrinsic nature of the interval variables leads to special structures of the variance-covariance matrix, which are represented by four different possible configurations. *MAINT.Data* implements the proposed methodologies in the S4 object system, introducing a specific data class for representing interval data. It includes functions and methods for modelling and analysing interval data, in particular maximum likelihood estimation, statistical tests for the different configurations, (M)ANOVA and Discriminant Analysis. For the Gaussian model, Model-based Clustering, robust estimation, outlier detection and Robust Discriminant Analysis are also available.
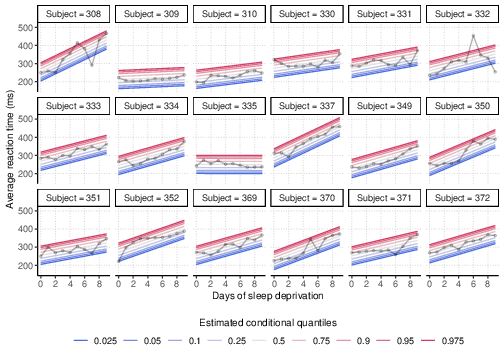
tramME: Mixed-Effects Transformation Models Using Template Model Builder
Linear transformation models constitute a general family of parametric regression models for discrete and continuous responses. To accommodate correlated responses, the model is extended by incorporating mixed effects. This article presents the R package *tramME*, which builds on existing implementations of transformation models (*mlt* and *tram* packages) as well as Laplace approximation and automatic differentiation (using the *TMB* package), to calculate estimates and perform likelihood inference in mixed-effects transformation models. The resulting framework can be readily applied to a wide range of regression problems with grouped data structures.
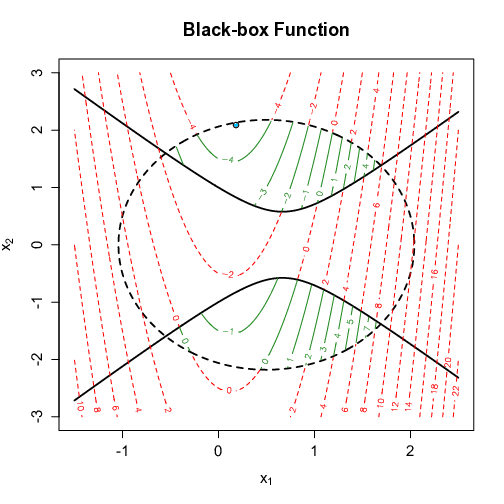
CompModels: A Suite of Computer Model Test Functions for Bayesian Optimization
The [*CompModels*](https://CRAN.R-project.org/package=CompModels) package for R provides a suite of computer model test functions that can be used for computer model prediction/emulation, uncertainty quantification, and calibration. Moreover, the [*CompModels*](https://CRAN.R-project.org/package=CompModels) package is especially well suited for the sequential optimization of computer models. The package is a mix of real-world physics problems, known mathematical functions, and black-box functions that have been converted into computer models with the goal of Bayesian (i.e., sequential) optimization in mind. Likewise, the package contains computer models that represent either the constrained or unconstrained optimization case, each with varying levels of difficulty. In this paper, we illustrate the use of the package with both real-world examples and black-box functions by solving constrained optimization problems via Bayesian optimization. Ultimately, the package is shown to provide users with a source of computer model test functions that are reproducible, shareable, and that can be used for benchmarking of novel optimization methods.

volesti: Volume Approximation and Sampling for Convex Polytopes in R
Sampling from high-dimensional distributions and volume approximation of convex bodies are fundamental operations that appear in optimization, finance, engineering, artificial intelligence, and machine learning. In this paper, we present *volesti*, an R package that provides efficient, scalable algorithms for volume estimation, uniform, and Gaussian sampling from convex polytopes. *volesti* scales to hundreds of dimensions, handles efficiently three different types of polyhedra and provides non existing sampling routines to R. We demonstrate the power of *volesti* by solving several challenging problems using the R language.
Elliptical Symmetry Tests in R
The assumption of elliptical symmetry has an important role in many theoretical developments and applications. Hence, it is of primary importance to be able to test whether that assumption actually holds true or not. Various tests have been proposed in the literature for this problem. To the best of our knowledge, none of them has been implemented in R. This article describes the R package [*ellipticalsymmetry*](https://CRAN.R-project.org/package=ellipticalsymmetry) which implements several well-known tests for elliptical symmetry together with some recent tests. We demonstrate the testing procedures with a real data example.
The bdpar Package: Big Data Pipelining Architecture for R
In the last years, big data has become a useful paradigm for taking advantage of multiple sources to find relevant knowledge in real domains (such as the design of personalized marketing campaigns or helping to palliate the effects of several fatal diseases). Big data programming tools and methods have evolved over time from a MapReduce to a pipeline-based archetype. Concretely the use of pipelining schemes has become the most reliable way of processing and analyzing large amounts of data. To this end, this work introduces *bdpar*, a new highly customizable pipeline-based framework (using the OOP paradigm provided by [*R6*](https://CRAN.R-project.org/package=R6) package) able to execute multiple preprocessing tasks over heterogeneous data sources. Moreover, to increase the flexibility and performance, *bdpar* provides helpful features such as (i) the definition of a novel object-based pipe operator (`%>|%`), (ii) the ability to easily design and deploy new (and customized) input data parsers, tasks, and pipelines, (iii) only-once execution which avoids the execution of previously processed information (instances), guaranteeing that only new both input data and pipelines are executed, (iv) the capability to perform serial or parallel operations according to the user needs, (v) the inclusion of a debugging mechanism which allows users to check the status of each instance (and find possible errors) throughout the process.
g2f as a Novel Tool to Find and Fill Gaps in Metabolic Networks
During the building of a genome-scale metabolic model, there are several dead-end metabolites and substrates which cannot be imported, produced, nor used by any reaction incorporated in the network. The presence of these dead-end metabolites can block out the net flux of the objective function when it is evaluated through Flux Balance Analysis (FBA), and when it is not blocked, bias in the biological conclusions increase. In this aspect, the refinement to restore the connectivity of the network can be carried out manually or using computational algorithms. The *g2f* package was designed as a tool to find the gaps from dead-end metabolites and fill them from the stoichiometric reactions of a reference, filtering candidate reactions using a weighting function. Additionally, this algorithm allows downloading all the sets of gene-associated stoichiometric reactions for a specific organism from the KEGG database. Our package is compatible with both 4.0.0 and 3.6.0 R versions.
ROCnReg: An R Package for Receiver Operating Characteristic Curve Inference With and Without Covariates
This paper introduces the package *ROCnReg* that allows estimating the pooled ROC curve, the covariate-specific ROC curve, and the covariate-adjusted ROC curve by different methods, both from (semi) parametric and nonparametric perspectives and within Bayesian and frequentist paradigms. From the estimated ROC curve (pooled, covariate-specific, or covariate-adjusted), several summary measures of discriminatory accuracy, such as the (partial) area under the ROC curve and the Youden index, can be obtained. The package also provides functions to obtain ROC-based optimal threshold values using several criteria, namely, the Youden index criterion and the criterion that sets a target value for the false positive fraction. For the Bayesian methods, we provide tools for assessing model fit via posterior predictive checks, while the model choice can be carried out via several information criteria. Numerical and graphical outputs are provided for all methods. This is the only package implementing Bayesian procedures for ROC curves.

A New Versatile Discrete Distribution
This paper introduces a new flexible distribution for discrete data. Approximate moment estimators of the parameters of the distribution, to be used as starting values for numerical optimization procedures, are discussed. "Exact" moment estimation, effected via a numerical procedure, and maximum likelihood estimation, are considered. The quality of the results produced by these estimators is assessed via simulation experiments. Several examples are given of fitting instances of the new distribution to real and simulated data. It is noted that the new distribution is a member of the exponential family. Expressions for the gradient and Hessian of the log-likelihood of the new distribution are derived. The former facilitates the numerical maximization of the likelihood with `optim()`; the latter provides means of calculating or estimating the covariance matrix of of the parameter estimates. A discrepancy between estimates of the covariance matrix obtained by inverting the Hessian and those obtained by Monte Carlo methods is discussed.
BayesSPsurv: An R Package to Estimate Bayesian (Spatial) Split-Population Survival Models
Survival data often include a fraction of units that are susceptible to an event of interest as well as a fraction of "immune" units. In many applications, spatial clustering in unobserved risk factors across nearby units can also affect their survival rates and odds of becoming immune. To address these methodological challenges, this article introduces our [*BayesSPsurv*](https://CRAN.R-project.org/package=BayesSPsurv) R-package, which fits parametric Bayesian Spatial split-population survival (cure) models that can account for spatial autocorrelation in both subpopulations of the user's time-to-event data. Spatial autocorrelation is modeled with spatially weighted frailties, which are estimated using a conditionally autoregressive prior. The user can also fit parametric cure models with or without nonspatial i.i.d. frailties, and each model can incorporate time-varying covariates. *BayesSPsurv* also includes various functions to conduct pre-estimation spatial autocorrelation tests, visualize results, and assess model performance, all of which are illustrated using data on post-civil war peace survival.
A Method for Deriving Information from Running R Code
It is often useful to tap information from a running R script. Obvious use cases include monitoring the consumption of resources (time, memory) and logging. Perhaps less obvious cases include tracking changes in R objects or collecting the output of unit tests. In this paper, we demonstrate an approach that abstracts the collection and processing of such secondary information from the running R script. Our approach is based on a combination of three elements. The first element is to build a customized way to evaluate code. The second is labeled *local masking* and it involves temporarily masking a user-facing function so an alternative version of it is called. The third element we label *local side effect*. This refers to the fact that the masking function exports information to the secondary information flow without altering a global state. The result is a method for building systems in pure R that lets users create and control secondary flows of information with minimal impact on their workflow and no global side effects.
Reproducible Summary Tables with the gtsummary Package
The *gtsummary* package provides an elegant and flexible way to create publication-ready summary tables in R. A critical part of the work of statisticians, data scientists, and analysts is summarizing data sets and regression models in R and publishing or sharing polished summary tables. The *gtsummary* package was created to streamline these everyday analysis tasks by allowing users to easily create reproducible summaries of data sets, regression models, survey data, and survival data with a simple interface and very little code. The package follows a tidy framework, making it easy to integrate with standard data workflows, and offers many table customization features through function arguments, helper functions, and custom themes.
garchx: Flexible and Robust GARCH-X Modeling
The *garchx* package provides a user-friendly, fast, flexible, and robust framework for the estimation and inference of GARCH($p,q,r$)-X models, where $p$ is the ARCH order, $q$ is the GARCH order, $r$ is the asymmetry or leverage order, and 'X' indicates that covariates can be included. Quasi Maximum Likelihood (QML) methods ensure estimates are consistent and standard errors valid, even when the standardized innovations are non-normal or dependent, or both. Zero-coefficient restrictions by omission enable parsimonious specifications, and functions to facilitate the non-standard inference associated with zero-restrictions in the null-hypothesis are provided. Finally, in the formal comparisons of precision and speed, the *garchx* package performs well relative to other prominent GARCH-packages on CRAN.
gofCopula: Goodness-of-Fit Tests for Copulae
The last decades show an increased interest in modeling various types of data through copulae. Different copula models have been developed, which lead to the challenge of finding the best fitting model for a particular dataset. From the other side, a strand of literature developed a list of different Goodness-of-Fit (GoF) tests with different powers under different conditions. The usual practice is the selection of the best copula via the $p$-value of the GoF test. Although this method is not purely correct due to the fact that non-rejection does not imply acception, this strategy is favored by practitioners. Unfortunately, different GoF tests often provide contradicting outputs. The proposed R-package brings under one umbrella 13 most used copulae - plus their rotated variants - together with 16 GoF tests and a hybrid one. The package offers flexible margin modeling, automatized parallelization, parameter estimation, as well as a user-friendly interface, and pleasant visualizations of the results. To illustrate the functionality of the package, two exemplary applications are provided.
The HBV.IANIGLA Hydrological Model
Over the past 40 years, the HBV (Hydrologiska Byråns Vattenbalansavdelning) hydrological model has been one of the most used worldwide due to its robustness, simplicity, and reliable results. Despite these advantages, the available versions impose some limitations for research studies in mountain watersheds dominated by ice-snow melt runoff (i.e., no glacier module, a limited number of elevation bands, among other constraints). Here we present HBV.IANIGLA, a tool for hydroclimatic studies in regions with steep topography and/or cryospheric processes which provides a modular and extended implementation of the HBV model as an R package. To our knowledge, this is the first modular version of the original HBV model. This feature can be very useful for teaching hydrological modeling, as it offers the possibility to build a customized, open-source model that can be adjusted to different requirements of students and users.
penPHcure: Variable Selection in Proportional Hazards Cure Model with Time-Varying Covariates
We describe the [*penPHcure*](https://CRAN.R-project.org/package=penPHcure) R package, which implements the semiparametric proportional-hazards (PH) cure model of @Sy_Taylor_2000 extended to time-varying covariates and the variable selection technique based on its SCAD-penalized likelihood proposed by @Beretta_Heuchenne_2019. In survival analysis, cure models are a useful tool when a fraction of the population is likely to be immune from the event of interest. They can separate the effects of certain factors on the probability of being susceptible and on the time until the occurrence of the event. Moreover, the *penPHcure* package allows the user to simulate data from a PH cure model, where the event-times are generated on a continuous scale from a piecewise exponential distribution conditional on time-varying covariates, with a method similar to @Hendry_2014. We present the results of a simulation study to assess the finite sample performance of the methodology and illustrate the functionalities of the *penPHcure* package using criminal recidivism data.
Unidimensional and Multidimensional Methods for Recurrence Quantification Analysis with crqa
Recurrence quantification analysis is a widely used method for characterizing patterns in time series. This article presents a comprehensive survey for conducting a wide range of recurrence-based analyses to quantify the dynamical structure of single and multivariate time series and capture coupling properties underlying leader-follower relationships. The basics of recurrence quantification analysis (RQA) and all its variants are formally introduced step-by-step from the simplest auto-recurrence to the most advanced multivariate case. Importantly, we show how such RQA methods can be deployed under a single computational framework in R using a substantially renewed version of our *crqa* 2.0 package. This package includes implementations of several recent advances in recurrence-based analysis, among them applications to multivariate data and improved entropy calculations for categorical data. We show concrete applications of our package to example data, together with a detailed description of its functions and some guidelines on their usage.
stratamatch: Prognostic Score Stratification Using a Pilot Design
Optimal propensity score matching has emerged as one of the most ubiquitous approaches for causal inference studies on observational data. However, outstanding critiques of the statistical properties of propensity score matching have cast doubt on the statistical efficiency of this technique, and the poor scalability of optimal matching to large data sets makes this approach inconvenient if not infeasible for sample sizes that are increasingly commonplace in modern observational data. The [*stratamatch*](https://CRAN.R-project.org/package=stratamatch) package provides implementation support and diagnostics for 'stratified matching designs,' an approach that addresses both of these issues with optimal propensity score matching for large-sample observational studies. First, stratifying the data enables more computationally efficient matching of large data sets. Second, *stratamatch* implements a 'pilot design' approach in order to stratify by a prognostic score, which may increase the precision of the effect estimate and increase power in sensitivity analyses of unmeasured confounding.
distr6: R6 Object-Oriented Probability Distributions Interface in R
*distr6* is an object-oriented (OO) probability distributions interface leveraging the extensibility and scalability of R6 and the speed and efficiency of *Rcpp*. Over 50 probability distributions are currently implemented in the package with 'core' methods, including density, distribution, and generating functions, and more 'exotic' ones, including hazards and distribution function anti-derivatives. In addition to simple distributions, *distr6* supports compositions such as truncation, mixtures, and product distributions. This paper presents the core functionality of the package and demonstrates examples for key use-cases. In addition, this paper provides a critical review of the object-oriented programming paradigms in R and describes some novel implementations for design patterns and core object-oriented features introduced by the package for supporting *distr6* components.
OneStep : Le Cam's One-step Estimation Procedure
The *OneStep* package proposes principally an eponymic function that numerically computes Le Cam's one-step estimator, which is asymptotically efficient and can be computed faster than the maximum likelihood estimator for large datasets. Monte Carlo simulations are carried out for several examples (discrete and continuous probability distributions) in order to exhibit the performance of Le Cam's one-step estimation procedure in terms of efficiency and computational cost on observation samples of finite size.
The R Package smicd: Statistical Methods for Interval-Censored Data
The package allows the use of two new statistical methods for the analysis of interval-censored data: 1) direct estimation/prediction of statistical indicators and 2) linear (mixed) regression analysis. Direct estimation of statistical indicators, for instance, poverty and inequality indicators, is facilitated by a non parametric kernel density algorithm. The algorithm is able to account for weights in the estimation of statistical indicators. The standard errors of the statistical indicators are estimated with a non parametric bootstrap. Furthermore, the package offers statistical methods for the estimation of linear and linear mixed regression models with an interval-censored dependent variable, particularly random slope and random intercept models. Parameter estimates are obtained through a stochastic expectation-maximization algorithm. Standard errors are estimated using a non parametric bootstrap in the linear regression model and by a parametric bootstrap in the linear mixed regression model. To handle departures from the model assumptions, fixed (logarithmic) and data-driven (Box-Cox) transformations are incorporated into the algorithm.
krippendorffsalpha: An R Package for Measuring Agreement Using Krippendorff's Alpha Coefficient
R package [*krippendorffsalpha*](https://CRAN.R-project.org/package=krippendorffsalpha) provides tools for measuring agreement using Krippendorff's $\alpha$ coefficient, a well-known nonparametric measure of agreement (also called inter-rater reliability and various other names). This article first develops Krippendorff's $\alpha$ in a natural way and situates $\alpha$ among statistical procedures. Then, the usage of package [*krippendorffsalpha*](https://CRAN.R-project.org/package=krippendorffsalpha) is illustrated via analyses of two datasets, the latter of which was collected during an imaging study of hip cartilage. The package permits users to apply the $\alpha$ methodology using built-in distance functions for the nominal, ordinal, interval, or ratio levels of measurement. User-defined distance functions are also supported. The fitting function can accommodate any number of units, any number of coders, and missingness. Bootstrap inference is supported, and the bootstrap computation can be carried out in parallel.
Working with CRSP/COMPUSTAT in R: Reproducible Empirical Asset Pricing
It is common to come across SAS or Stata manuals while working on academic empirical finance research. Nonetheless, given the popularity of open-source programming languages such as R, there are fewer resources in R covering popular databases such as CRSP and COMPUSTAT. The aim of this article is to bridge the gap and illustrate how to leverage R in working with both datasets. As an application, we illustrate how to form size-value portfolios with respect to [@fama1993common] and study the sensitivity of the results with respect to different inputs. Ultimately, the purpose of the article is to advocate reproducible finance research and contribute to the recent idea of "Open Source Cross-Sectional Asset Pricing", proposed by @chen2020open.
Analyzing Dependence between Point Processes in Time Using IndTestPP
The need to analyze the dependence between two or more point processes in time appears in many modeling problems related to the occurrence of events, such as the occurrence of climate events at different spatial locations or synchrony detection in spike train analysis. The package *IndTestPP* provides a general framework for all the steps in this type of analysis, and one of its main features is the implementation of three families of tests to study independence given the intensities of the processes, which are not only useful to assess independence but also to identify factors causing dependence. The package also includes functions for generating different types of dependent point processes, and implements computational statistical inference tools using them. An application to characterize the dependence between the occurrence of extreme heat events in three Spanish locations using the package is shown.
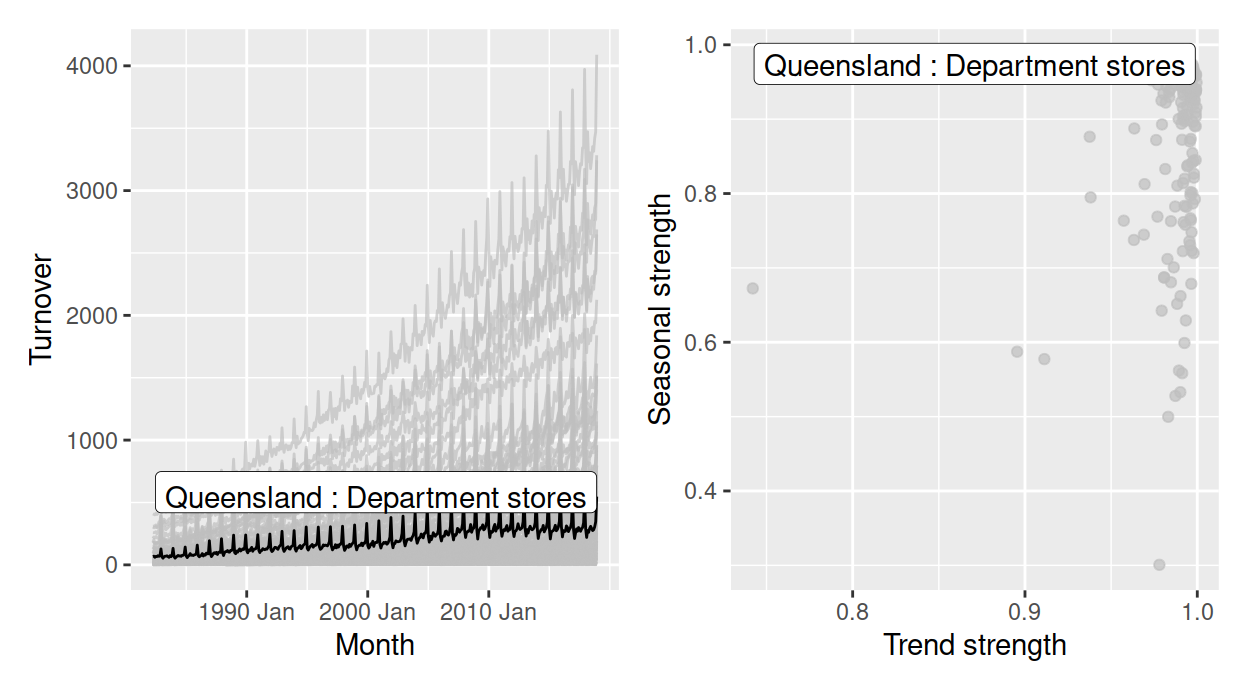
Conversations in Time: Interactive Visualization to Explore Structured Temporal Data
Temporal data often has a hierarchical structure, defined by categorical variables describing different levels, such as political regions or sales products. The nesting of categorical variables produces a hierarchical structure. The tsibbletalk package is developed to allow a user to interactively explore temporal data, relative to the nested or crossed structures. It can help to discover differences between category levels, and uncover interesting periodic or aperiodic slices. The package implements a shared `tsibble` object that allows for linked brushing between coordinated views, and a shiny module that aids in wrapping timelines for seasonal patterns. The tools are demonstrated using two data examples: domestic tourism in Australia and pedestrian traffic in Melbourne.
Automating Reproducible, Collaborative Clinical Trial Document Generation with the listdown Package
The conveyance of clinical trial explorations and analysis results from a statistician to a clinical investigator is a critical component of the drug development and clinical research cycle. Automating the process of generating documents for data descriptions, summaries, exploration, and analysis allows the statistician to provide a more comprehensive view of the information captured by a clinical trial, and efficient generation of these documents allows the statistican to focus more on the conceptual development of a trial or trial analysis and less on the implementation of the summaries and results on which decisions are made. This paper explores the use of the *listdown* package for automating reproducible documents in clinical trials that facilitate the collaboration between statisticians and clinicians as well as defining an analysis pipeline for document generation.
Towards a Grammar for Processing Clinical Trial Data
The goal of this paper is to help define a path toward a grammar for processing clinical trials by a) defining a format in which we would like to represent data from standardized clinical trial data b) describing a standard set of operations to transform clinical trial data into this format, and c) to identify a set of verbs and other functionality to facilitate data processing and encourage reproducibility in the processing of these data. It provides a background on standard clinical trial data and goes through a simple preprocessing example illustrating the value of the proposed approach through the use of the *forceps* package, which is currently being used for data of this kind.
Regularized Transformation Models: The tramnet Package
The [*tramnet*](https://CRAN.R-project.org/package=tramnet) package implements regularized linear transformation models by combining the flexible class of transformation models from [*tram*](https://CRAN.R-project.org/package=tram) with constrained convex optimization implemented in [*CVXR*](https://CRAN.R-project.org/package=CVXR). Regularized transformation models unify many existing and novel regularized regression models under one theoretical and computational framework. Regularization strategies implemented for transformation models in *tramnet* include the Lasso, ridge regression, and the elastic net and follow the parameterization in [*glmnet*](https://CRAN.R-project.org/package=glmnet). Several functionalities for optimizing the hyperparameters, including model-based optimization based on the [*mlrMBO*](https://CRAN.R-project.org/package=mlrMBO) package, are implemented. A multitude of `S3` methods is deployed for visualization, handling, and simulation purposes. This work aims at illustrating all facets of *tramnet* in realistic settings and comparing regularized transformation models with existing implementations of similar models.
SEEDCCA: An Integrated R-Package for Canonical Correlation Analysis and Partial Least Squares
Canonical correlation analysis (CCA) has a long history as an explanatory statistical method in high-dimensional data analysis and has been successfully applied in many scientific fields such as chemometrics, pattern recognition, genomic sequence analysis, and so on. The so-called *seedCCA* is a newly developed *R* package that implements not only the standard and seeded CCA but also partial least squares. The package enables us to fit CCA to large-$p$ and small-$n$ data. The paper provides a complete guide. Also, the seeded CCA application results are compared with the regularized CCA in the existing *R* package. It is believed that the package, along with the paper, will contribute to high-dimensional data analysis in various science field practitioners and that the statistical methodologies in multivariate analysis become more fruitful.
npcure: An R Package for Nonparametric Inference in Mixture Cure Models
Mixture cure models have been widely used to analyze survival data with a cure fraction. They assume that a subgroup of the individuals under study will never experience the event (cured subjects). So, the goal is twofold: to study both the cure probability and the failure time of the uncured individuals through a proper survival function (latency). The R package *npcure* implements a completely nonparametric approach for estimating these functions in mixture cure models, considering right-censored survival times. Nonparametric estimators for the cure probability and the latency as functions of a covariate are provided. Bootstrap bandwidth selectors for the estimators are included. The package also implements a nonparametric covariate significance test for the cure probability, which can be applied with a continuous, discrete, or qualitative covariate.
JMcmprsk: An R Package for Joint Modelling of Longitudinal and Survival Data with Competing Risks
In this paper, we describe an R package named **JMcmprsk**, for joint modelling of longitudinal and survival data with competing risks. The package in its current version implements two joint models of longitudinal and survival data proposed to handle competing risks survival data together with continuous and ordinal longitudinal outcomes respectively [@elashoff2008joint; @li2010joint]. The corresponding R implementations are further illustrated with real examples. The package also provides simulation functions to simulate datasets for joint modelling with continuous or ordinal outcomes under the competing risks scenario, which provide useful tools to validate and evaluate new joint modelling methods.
Wide-to-tall Data Reshaping Using Regular Expressions and the nc Package
Regular expressions are powerful tools for extracting tables from non-tabular text data. Capturing regular expressions that describe the information to extract from column names can be especially useful when reshaping a data table from wide (few rows with many regularly named columns) to tall (fewer columns with more rows). We present the R package *nc* (short for named capture), which provides functions for wide-to-tall data reshaping using regular expressions. We describe the main new ideas of *nc*, and provide detailed comparisons with related R packages (*stats*, *utils*, *data.table*, *tidyr*, *tidyfast*, *tidyfst*, *reshape2*, *cdata*).
Linear Regression with Stationary Errors: the R Package slm
This paper introduces the R package [*slm*](https://CRAN.R-project.org/package=slm), which stands for Stationary Linear Models. The package contains a set of statistical procedures for linear regression in the general context where the error process is strictly stationary with a short memory. We work in the setting of [@hannan1973central], who proved the asymptotic normality of the (normalized) least squares estimators (LSE) under very mild conditions on the error process. We propose different ways to estimate the asymptotic covariance matrix of the LSE and then to correct the type I error rates of the usual tests on the parameters (as well as confidence intervals). The procedures are evaluated through different sets of simulations.
exPrior: An R Package for the Formulation of Ex-Situ Priors
The [*exPrior*](https://CRAN.R-project.org/package=exPrior) package implements a procedure for formulating informative priors of geostatistical properties for a target field site, called *ex-situ priors* and introduced in [@Cucchi2019]. The procedure uses a Bayesian hierarchical model to assimilate multiple types of data coming from multiple sites considered as similar to the target site. This prior summarizes the information contained in the data in the form of a probability density function that can be used to better inform further geostatistical investigations at the site. The formulation of the prior uses ex-situ data, where the data set can either be gathered by the user or come in the form of a structured database. The package is designed to be flexible in that regard. For illustration purposes and for easiness of use, the package is ready to be used with the worldwide hydrogeological parameter database (WWHYPDA) [@Comunian2009].
clustcurv: An R Package for Determining Groups in Multiple Curves
In many situations, it could be interesting to ascertain whether groups of curves can be performed, especially when confronted with a considerable number of curves. This paper introduces an R package, known as [*clustcurv*](https://CRAN.R-project.org/package=clustcurv), for determining clusters of curves with an automatic selection of their number. The package can be used for determining groups in multiple survival curves as well as for multiple regression curves. Moreover, it can be used with large numbers of curves. An illustration of the use of *clustcurv* is provided, using both real data examples and artificial data.
Benchmarking R packages for Calculation of Persistent Homology
Several persistent homology software libraries have been implemented in R. Specifically, the Dionysus, GUDHI, and Ripser libraries have been wrapped by the **TDA** and **TDAstats** CRAN packages. These software represent powerful analysis tools that are computationally expensive and, to our knowledge, have not been formally benchmarked. Here, we analyze runtime and memory growth for the 2 R packages and the 3 underlying libraries. We find that datasets with less than 3 dimensions can be evaluated with persistent homology fastest by the GUDHI library in the **TDA** package. For higher-dimensional datasets, the Ripser library in the TDAstats package is the fastest. Ripser and **TDAstats** are also the most memory-efficient tools to calculate persistent homology.
Statistical Quality Control with the qcr Package
The R package [*qcr*](https://CRAN.R-project.org/package=qcr) for Statistical Quality Control (SQC) is introduced and described. It includes a comprehensive set of univariate and multivariate SQC tools that completes and increases the SQC techniques available in R. Apart from integrating different R packages devoted to SQC ([*qcc*](https://CRAN.R-project.org/package=qcc), [*MSQC*](https://CRAN.R-project.org/package=MSQC)), [*qcr*](https://CRAN.R-project.org/package=qcr) provides nonparametric tools that are highly useful when Gaussian assumption is not met. This package computes standard univariate control charts for individual measurements, $\bar{x}$, $S$, $R$, $p$, $np$, $c$, $u$, EWMA, and CUSUM. In addition, it includes functions to perform multivariate control charts such as Hotelling T$^2$, MEWMA and MCUSUM. As representative features, multivariate nonparametric alternatives based on data depth are implemented in this package: $r$, $Q$ and $S$ control charts. The [*qcr*](https://CRAN.R-project.org/package=qcr) library also estimates the most complete set of capability indices from first to the fourth generation, covering the nonparametric alternatives, and performing the corresponding capability analysis graphical outputs, including the process capability plots. Moreover, Phase I and II control charts for functional data are included.
pdynmc: A Package for Estimating Linear Dynamic Panel Data Models Based on Nonlinear Moment Conditions
This paper introduces [*pdynmc*](https://CRAN.R-project.org/package=pdynmc), an R package that provides users sufficient flexibility and precise control over the estimation and inference in linear dynamic panel data models. The package primarily allows for the inclusion of nonlinear moment conditions and the use of iterated GMM; additionally, visualizations for data structure and estimation results are provided. The current implementation reflects recent developments in literature, uses sensible argument defaults, and aligns commercial and noncommercial estimation commands. Since the understanding of the model assumptions is vital for setting up plausible estimation routines, we provide a broad introduction of linear dynamic panel data models directed towards practitioners before concisely describing the functionality available in *pdynmc* regarding instrument type, covariate type, estimation methodology, and general configuration. We then demonstrate the functionality by revisiting the popular firm-level dataset of @AreBon1991.
DChaos: An R Package for Chaotic Time Series Analysis
Chaos theory has been hailed as a revolution of thoughts and attracting ever-increasing attention of many scientists from diverse disciplines. Chaotic systems are non-linear deterministic dynamic systems which can behave like an erratic and apparently random motion. A relevant field inside chaos theory is the detection of chaotic behavior from empirical time-series data. One of the main features of chaos is the well-known initial-value sensitivity property. Methods and techniques related to testing the hypothesis of chaos try to quantify the initial-value sensitive property estimating the so-called Lyapunov exponents. This paper describes the main estimation methods of the Lyapunov exponent from time series data. At the same time, we present the *DChaos* library. R users may compute the delayed-coordinate embedding vector from time series data, estimates the best-fitted neural net model from the delayed-coordinate embedding vectors, calculates analytically the partial derivatives from the chosen neural nets model. They can also obtain the neural net estimator of the Lyapunov exponent from the partial derivatives computed previously by two different procedures and four ways of subsampling by blocks. To sum up, the *DChaos* package allows the R users to test robustly the hypothesis of chaos in order to know if the data-generating process behind time series behaves chaotically or not. The package's functionality is illustrated by examples.
IndexNumber: An R Package for Measuring the Evolution of Magnitudes
Index numbers are descriptive statistical measures useful in economic settings for comparing simple and complex magnitudes registered, usually in two time periods. Although this theory has a large history, it still plays an important role in modern today's societies where big amounts of economic data are available and need to be analyzed. After a detailed revision on classical index numbers in literature, this paper is focused on the description of the R package [*IndexNumber*](https://CRAN.R-project.org/package=IndexNumber) with strong capabilities for calculating them. Two of the four real data sets contained in this library are used for illustrating the determination of the index numbers in this work. Graphical tools are also implemented in order to show the time evolution of considered magnitudes simplifying the interpretation of the results.
StratigrapheR: Concepts for Litholog Generation in R
The [*StratigrapheR*](https://CRAN.R-project.org/package=StratigrapheR) package proposes new concepts for the generation of lithological logs, or lithologs, in R. The generation of lithologs in a scripting environment opens new opportunities for the processing and analysis of stratified geological data. Among the new concepts presented: new plotting and data processing methodologies, new general R functions, and computer-oriented data conventions are provided. The package structure allows for these new concepts to be further improved, which can be done independently by any R user. The current limitations of the package are highlighted, along with the limitations in R for geological data processing, to help identify the best paths for improvements.
ROBustness In Network (robin): an R Package for Comparison and Validation of Communities
In network analysis, many community detection algorithms have been developed. However, their implementation leaves unaddressed the question of the statistical validation of the results. Here, we present [*robin*](https://CRAN.R-project.org/package=robin) (ROBustness In Network), an R package to assess the robustness of the community structure of a network found by one or more methods to give indications about their reliability. The procedure initially detects if the community structure found by a set of algorithms is statistically significant and then compares two selected detection algorithms on the same graph to choose the one that better fits the network of interest. We demonstrate the use of our package on the American College Football benchmark dataset.
Finding Optimal Normalizing Transformations via bestNormalize
The *bestNormalize* R package was designed to help users find a transformation that can effectively normalize a vector regardless of its actual distribution. Each of the many normalization techniques that have been developed has its own strengths and weaknesses, and deciding which to use until data are fully observed is difficult or impossible. This package facilitates choosing between a range of possible transformations and will automatically return the best one, i.e., the one that makes data look the *most* normal. To evaluate and compare the normalization efficacy across a suite of possible transformations, we developed a statistic based on a goodness of fit test divided by its degrees of freedom. Transformations can be seamlessly trained and applied to newly observed data and can be implemented in conjunction with *caret* and *recipes* for data preprocessing in machine learning workflows. Custom transformations and normalization statistics are supported.
Package wsbackfit for Smooth Backfitting Estimation of Generalized Structured Models
A package is introduced that provides the weighted smooth backfitting estimator for a large family of popular semiparametric regression models. This family is known as *generalized structured models*, comprising, for example, generalized varying coefficient model, generalized additive models, mixtures, potentially including parametric parts. The kernel-based weighted smooth backfitting belongs to the statistically most efficient procedures for this model class. Its asymptotic properties are well-understood thanks to the large body of literature about this estimator. The introduced weights allow for the inclusion of sampling weights, trimming, and efficient estimation under heteroscedasticity. Further options facilitate easy handling of aggregated data, prediction, and the presentation of estimation results. Cross-validation methods are provided which can be used for model and bandwidth selection.[^1]
RLumCarlo: Simulating Cold Light using Monte Carlo Methods
The luminescence phenomena of insulators and semiconductors (e.g., natural minerals such as quartz) have various application domains. For instance, Earth Sciences and archaeology exploit luminescence as a dating method. Herein, we present the R package [*RLumCarlo*](https://CRAN.R-project.org/package=RLumCarlo) implementing sets of luminescence models to be simulated with Monte Carlo (MC) methods. MC methods make a powerful ally to all kinds of simulation attempts involving stochastic processes. Luminescence production is such a stochastic process in the form of charge (electron-hole pairs) interaction within insulators and semiconductors. To simulate luminescence-signal curves, we distribute single and independent MC processes to virtual MC clusters. [*RLumCarlo*](https://CRAN.R-project.org/package=RLumCarlo) comes with a modularized design and consistent user interface: (1) C++ functions represent the modeling core and implement models for specific stimulations modes. (2) R functions give access to combinations of models and stimulation modes, start the simulation and render terminal and graphical feedback. The combination of MC clusters supports the simulation of complex luminescence phenomena.
TULIP: A Toolbox for Linear Discriminant Analysis with Penalties
Linear discriminant analysis (LDA) is a powerful tool in building classifiers with easy computation and interpretation. Recent advancements in science technology have led to the popularity of datasets with high dimensions, high orders and complicated structure. Such datasetes motivate the generalization of LDA in various research directions. The R package *TULIP* integrates several popular high-dimensional LDA-based methods and provides a comprehensive and user-friendly toolbox for linear, semi-parametric and tensor-variate classification. Functions are included for model fitting, cross validation and prediction. In addition, motivated by datasets with diverse sources of predictors, we further include functions for covariate adjustment. Our package is carefully tailored for low storage and high computation efficiency. Moreover, our package is the first R package for many of these methods, providing great convenience to researchers in this area.
Kuhn-Tucker and Multiple Discrete-Continuous Extreme Value Model Estimation and Simulation in R: The rmdcev Package
This paper introduces the package *rmdcev* in R for estimation and simulation of Kuhn-Tucker demand models with individual heterogeneity. The models supported by *rmdcev* are the multiple-discrete continuous extreme value (MDCEV) model and Kuhn-Tucker specification common in the environmental economics literature on recreation demand. Latent class and random parameters specifications can be implemented and the models are fit using maximum likelihood estimation or Bayesian estimation. The *rmdcev* package also implements demand forecasting and welfare calculation for policy simulation. The purpose of this paper is to describe the model estimation and simulation framework and to demonstrate the functionalities of *rmdcev* using real datasets.
NTS: An R Package for Nonlinear Time Series Analysis
Linear time series models are commonly used in analyzing dependent data and in forecasting. On the other hand, real phenomena often exhibit nonlinear behavior and the observed data show nonlinear dynamics. This paper introduces the R package *NTS* that offers various computational tools and nonlinear models for analyzing nonlinear dependent data. The package fills the gaps of several outstanding R packages for nonlinear time series analysis. Specifically, the *NTS* package covers the implementation of threshold autoregressive (TAR) models, autoregressive conditional mean models with exogenous variables (ACMx), functional autoregressive models, and state-space models. Users can also evaluate and compare the performance of different models and select the best one for prediction. Furthermore, the package implements flexible and comprehensive sequential Monte Carlo methods (also known as particle filters) for modeling non-Gaussian or nonlinear processes. Several examples are used to demonstrate the capabilities of the *NTS* package.
Species Distribution Modeling using Spatial Point Processes: a Case Study of Sloth Occurrence in Costa Rica
Species distribution models are widely used in ecology for conservation management of species and their environments. This paper demonstrates how to fit a log-Gaussian Cox process model to predict the intensity of sloth occurrence in Costa Rica, and assess the effect of climatic factors on spatial patterns using the *R-INLA* package. Species occurrence data are retrieved using *spocc*, and spatial climatic variables are obtained with *raster*. Spatial data and results are manipulated and visualized by means of several packages such as *raster* and *tmap*. This paper provides an accessible illustration of spatial point process modeling that can be used to analyze data that arise in a wide range of fields including ecology, epidemiology and the environment.
A Graphical EDA Tool with ggplot2: brinton
We present [*brinton*](https://CRAN.R-project.org/package=brinton) package, which we developed for graphical exploratory data analysis in R. Based on [*ggplot2*](https://CRAN.R-project.org/package=ggplot2), [*gridExtra*](https://CRAN.R-project.org/package=gridExtra) and [*rmarkdown*](https://CRAN.R-project.org/package=rmarkdown), *brinton* package introduces `wideplot()` graphics for exploring the structure of a dataset through a grid of variables and graphic types. It also introduces `longplot()` graphics, which present the entire catalog of available graphics for representing a particular variable using a grid of graphic types and variations on these types. Finally, it introduces the `plotup()` function, which complements the previous two functions in that it presents a particular graphic for a specific variable of a dataset. This set of functions is useful for understanding the structure of a data set, discovering unexpected properties in the data, evaluating different graphic representations of these properties, and selecting a particular graphic for display on the screen.
MoTBFs: An R Package for Learning Hybrid Bayesian Networks Using Mixtures of Truncated Basis Functions
This paper introduces [*MoTBFs*](https://CRAN.R-project.org/package=MoTBFs), an R package for manipulating mixtures of truncated basis functions. This class of functions allows the representation of joint probability distributions involving discrete and continuous variables simultaneously, and includes mixtures of truncated exponentials and mixtures of polynomials as special cases. The package implements functions for learning the parameters of univariate, multivariate, and conditional distributions, and provides support for parameter learning in Bayesian networks with both discrete and continuous variables. Probabilistic inference using forward sampling is also implemented. Part of the functionality of the *MoTBFs* package relies on the [*bnlearn*](https://CRAN.R-project.org/package=bnlearn) package, which includes functions for learning the structure of a Bayesian network from a data set. Leveraging this functionality, the *MoTBFs* package supports learning of MoTBF-based Bayesian networks over hybrid domains. We give a brief introduction to the methodological context and algorithms implemented in the package. An extensive illustrative example is used to describe the package, its functionality, and its usage.
Analyzing Basket Trials under Multisource Exchangeability Assumptions
Basket designs are prospective clinical trials that are devised with the hypothesis that the presence of selected molecular features determine a patient's subsequent response to a particular "targeted" treatment strategy. Basket trials are designed to enroll multiple clinical subpopulations to which it is assumed that the therapy in question offers beneficial efficacy in the presence of the targeted molecular profile. The treatment, however, may not offer acceptable efficacy to all subpopulations enrolled. Moreover, for rare disease settings, such as oncology wherein these trials have become popular, marginal measures of statistical evidence are difficult to interpret for sparsely enrolled subpopulations. Consequently, basket trials pose challenges to the traditional paradigm for trial design, which assumes inter-patient exchangeability. The package [*basket*](https://CRAN.R-project.org/package=basket) for the R programmming environment facilitates the analysis of basket trials by implementing multi-source exchangeability models. By evaluating all possible pairwise exchangeability relationships, this hierarchical modeling framework facilitates Bayesian posterior shrinkage among a collection of discrete and pre-specified subpopulations. Analysis functions are provided to implement posterior inference of the response rates and all possible exchangeability relationships between subpopulations. In addition, the package can identify "poolable" subsets of and report their response characteristics. The functionality of the package is demonstrated using data from an oncology study with subpopulations defined by tumor histology.
OpenLand: Software for Quantitative Analysis and Visualization of Land Use and Cover Change
There is an increasing availability of spatially explicit, freely available land use and cover (LUC) time series worldwide. Because of the enormous amount of data this represents, the continuous updates and improvements in spatial and temporal resolution and category differentiation, as well as increasingly dynamic and complex changes made, manual data extraction and analysis is highly time consuming, and making software tools available to automatize LUC data assessment is becoming imperative. This paper presents a software developed in R, which combines LUC raster time series data and their transitions, calculates state-of-the-art LUC change indicators, and creates spatio-temporal visualizations, all in a coherent workflow. The functionality of the application developed is demonstrated using an LUC dataset of the Pantanal floodplain contribution area in Central Brazil.
FarmTest: An R Package for Factor-Adjusted Robust Multiple Testing
We provide a publicly available library [*FarmTest*](https://CRAN.R-project.org/package=FarmTest) in the R programming system. This library implements a factor-adjusted robust multiple testing principle proposed by [@FKSZ2017] for large-scale simultaneous inference on mean effects. We use a multi-factor model to explicitly capture the dependence among a large pool of variables. Three types of factors are considered: observable, latent, and a mixture of observable and latent factors. The non-factor case, which corresponds to standard multiple mean testing under weak dependence, is also included. The library implements a series of adaptive Huber methods integrated with fast data-driven tuning schemes to estimate model parameters and to construct test statistics that are robust against heavy-tailed and asymmetric error distributions. Extensions to two-sample multiple mean testing problems are also discussed. The results of some simulation experiments and a real data analysis are reported.
User-Specified General-to-Specific and Indicator Saturation Methods
General-to-Specific (GETS) modelling provides a comprehensive, systematic and cumulative approach to modelling that is ideally suited for conditional forecasting and counterfactual analysis, whereas Indicator Saturation (ISAT) is a powerful and flexible approach to the detection and estimation of structural breaks (e.g. changes in parameters), and to the detection of outliers. To these ends, multi-path backwards elimination, single and multiple hypothesis tests on the coefficients, diagnostics tests and goodness-of-fit measures are combined to produce a parsimonious final model. In many situations a specific model or estimator is needed, a specific set of diagnostics tests may be required, or a specific fit criterion is preferred. In these situations, if the combination of estimator/model, diagnostics tests and fit criterion is not offered in a pre-programmed way by publicly available software, then the implementation of user-specified GETS and ISAT methods puts a large programming-burden on the user. Generic functions and procedures that facilitate the implementation of user-specified GETS and ISAT methods for specific problems can therefore be of great benefit. The R package *gets* is the first software -- both inside and outside the R universe -- to provide a complete set of facilities for user-specified GETS and ISAT methods: User-specified model/estimator, user-specified diagnostics and user-specified goodness-of-fit criteria. The aim of this article is to illustrate how user-specified GETS and ISAT methods can be implemented with the R package *gets*.
The biglasso Package: A Memory- and Computation-Efficient Solver for Lasso Model Fitting with Big Data in R
Penalized regression models such as the lasso have been extensively applied to analyzing high-dimensional data sets. However, due to memory limitations, existing R packages like [*glmnet*](https://CRAN.R-project.org/package=glmnet) and [*ncvreg*](https://CRAN.R-project.org/package=ncvreg) are not capable of fitting lasso-type models for ultrahigh-dimensional, multi-gigabyte data sets that are increasingly seen in many areas such as genetics, genomics, biomedical imaging, and high-frequency finance. In this research, we implement an R package called [*biglasso*](https://CRAN.R-project.org/package=biglasso) that tackles this challenge. *biglasso* utilizes memory-mapped files to store the massive data on the disk, only reading data into memory when necessary during model fitting, and is thus able to handle out-of-core computation seamlessly. Moreover, it's equipped with newly proposed, more efficient feature screening rules, which substantially accelerate the computation. Benchmarking experiments show that our *biglasso* package, as compared to existing popular ones like *glmnet*, is much more memory- and computation-efficient. We further analyze a 36 GB simulated GWAS data set on a laptop with only 16 GB RAM to demonstrate the out-of-core computation capability of *biglasso* in analyzing massive data sets that cannot be accommodated by existing R packages.
Comparing Multiple Survival Functions with Crossing Hazards in R
It is frequently of interest in time-to-event analysis to compare multiple survival functions nonparametrically. However, when the hazard functions cross, tests in existing R packages do not perform well. To address the issue, we introduce the package *survELtest*, which provides tests for comparing multiple survival functions with possibly crossing hazards. Due to its powerful likelihood ratio formulation, this is the only R package to date that works when the hazard functions cross. We illustrate the use of the procedures in *survELtest* by applying them to data from randomized clinical trials and simulated datasets. We show that these methods lead to more significant results than those obtained by existing R packages.
A Unified Algorithm for the Non-Convex Penalized Estimation: The ncpen Package
Various R packages have been developed for the non-convex penalized estimation but they can only be applied to the smoothly clipped absolute deviation (SCAD) or minimax concave penalty (MCP). We develop an R package, entitled *ncpen*, for the non-convex penalized estimation in order to make data analysts to experience other non-convex penalties. The package *ncpen* implements a unified algorithm based on the convex concave procedure and modified local quadratic approximation algorithm, which can be applied to a broader range of non-convex penalties, including the SCAD and MCP as special examples. Many user-friendly functionalities such as generalized information criteria, cross-validation and ridge regularization are provided also.
Six Years of Shiny in Research - Collaborative Development of Web Tools in R
The use of *Shiny* in research publications is investigated over the six and a half years since the appearance of this popular web application framework for R, which has been utilised in many varied research areas. While it is demonstrated that the complexity of *Shiny* applications is limited by the background architecture, and real security concerns exist for novice app developers, the collaborative benefits are worth attention from the wider research community. *Shiny* simplifies the use of complex methodologies for people of different specialities, at the level of proficiency appropriate for the end user. This enables a diverse community of users to interact efficiently, and utilise cutting edge methodologies. The literature reviewed demonstrates that complex methodologies can be put into practice without insisting on investment in professional training, for a comprehensive understanding from all participants. It appears that *Shiny* opens up concurrent benefits in communication between those who analyse data and other disciplines, that would enrich much of the peer-reviewed research.
fitzRoy - An R Package to Encourage Reproducible Sports Analysis
The importance of reproducibility, and the related issue of open access to data, has received a lot of recent attention. Momentum on these issues is gathering in the sports analytics community. While Australian Rules football (AFL) is the leading commercial sport in Australia, unlike popular international sports, there has been no mechanism for the public to access comprehensive statistics on players and teams. Expert commentary currently relies heavily on data that isn't made readily accessible and this produces an unnecessary barrier for the development of an inclusive sports analytics community. We present the R package *fitzRoy* to provide easy access to AFL statistics.
Assembling Pharmacometric Datasets in R - The puzzle Package
Pharmacometric analyses are integral components of the drug development process. The core of each pharmacometric analysis is a dataset. The time required to construct a pharmacometrics dataset can sometimes be higher than the effort required for the modeling *per se*. To simplify the process, the puzzle R package has been developed aimed at simplifying and facilitating the time consuming and error prone task of assembling pharmacometrics datasets.\ Puzzle consist of a series of functions written in R. These functions create, from tabulated files, datasets that are compatible with the formatting requirements of the gold standard non-linear mixed effects modeling software.\ With only one function, `puzzle()`, complex pharmacometrics databases can easily be assembled. Users are able to select from different absorption processes such as zero- and first-order, or a combination of both. Furthermore, datasets containing data from one or more analytes, and/or one or more responses, and/or time dependent and/or independent covariates, and/or urine data can be simultaneously assembled.\ The *puzzle* package is a powerful and efficient tool that helps modelers, programmers and pharmacometricians through the challenging process of assembling pharmacometrics datasets.
RNGforGPD: An R Package for Generation of Univariate and Multivariate Generalized Poisson Data
This article describes the R package *RNGforGPD*, which is designed for the generation of univariate and multivariate generalized Poisson data. Some illustrative examples are given, the utility and functionality of the package are demonstrated; and its performance is assessed via simulations that are devised around both artificial and real data.
Testing the Equality of Normal Distributed and Independent Groups' Means Under Unequal Variances by doex Package
In this paper, we present the [*doex*](https://CRAN.R-project.org/package=doex) package contains the tests for equality of normal distributed and independent group means under unequal variances such as Cochran F, Welch-Aspin, Welch, Box, Scott-Smith, Brown-Forsythe, Johansen F, Approximate F, Alexander-Govern, Generalized F, Modified Brown-Forsythe, Permutation F, Adjusted Welch, B2, Parametric Bootstrap, Fiducial Approach, and Alvandi Generalized F-test. Most of these tests are not available in any package. Thus, *doex* is easy to use for researchers in multidisciplinary studies. In this study, an extensive Monte-Carlo simulation study is conducted to investigate the performance of the the tests for equality of normal distributed group means under unequal variances
A Fast and Scalable Implementation Method for Competing Risks Data with the R Package fastcmprsk
Advancements in medical informatics tools and high-throughput biological experimentation make large-scale biomedical data routinely accessible to researchers. Competing risks data are typical in biomedical studies where individuals are at risk to more than one cause (type of event) which can preclude the others from happening. The [@fine1999proportional] proportional subdistribution hazards model is a popular and well-appreciated model for competing risks data and is currently implemented in a number of statistical software packages. However, current implementations are not computationally scalable for large-scale competing risks data. We have developed an R package, [*fastcmprsk*](https://CRAN.R-project.org/package=fastcmprsk), that uses a novel forward-backward scan algorithm to significantly reduce the computational complexity for parameter estimation by exploiting the structure of the subject-specific risk sets. Numerical studies compare the speed and scalability of our implementation to current methods for unpenalized and penalized Fine-Gray regression and show impressive gains in computational efficiency.
ordinalClust: An R Package to Analyze Ordinal Data
Ordinal data are used in many domains, especially when measurements are collected from people through observations, tests, or questionnaires. [*ordinalClust*](https://CRAN.R-project.org/package=ordinalClust) is an innovative R package dedicated to ordinal data that provides tools for modeling, clustering, co-clustering and classifying such data. Ordinal data are modeled using the BOS distribution, which is a model with two meaningful parameters referred to as \"position\" and \"precision\". The former indicates the mode of the distribution and the latter describes how scattered the data are around the mode: the user is able to easily interpret the distribution of their data when given these two parameters. The package is based on the co-clustering framework (when rows and columns are simultaneously clustered). The co-clustering approach uses the Latent Block Model (LBM) and the SEM-Gibbs algorithm for parameter inference. On the other hand, the clustering and the classification methods follow on from simplified versions of the SEM-Gibbs algorithm. For the classification process, two approaches are proposed. In the first one, the BOS parameters are estimated from the training dataset in the conventional way. In the second approach, parsimony is introduced by estimating the parameters and column-clusters from the training dataset. We empirically show that this approach can yield better results. For the clustering and co-clustering processes, the ICL-BIC criterion is used for model selection purposes. An overview of these methods is given, and the way to use them with the *ordinalClust* package is described using real datasets. The latest stable package version is available on the Comprehensive R Archive Network (CRAN).
KSPM: A Package For Kernel Semi-Parametric Models
Kernel semi-parametric models and their equivalence with linear mixed models provide analysts with the flexibility of machine learning methods and a foundation for inference and tests of hypothesis. These models are not impacted by the number of predictor variables, since the kernel trick transforms them to a kernel matrix whose size only depends on the number of subjects. Hence, methods based on this model are appealing and numerous, however only a few R programs are available and none includes a complete set of features. Here, we present the *KSPM* package to fit the kernel semi-parametric model and its extensions in a unified framework. *KSPM* allows multiple kernels and unlimited interactions in the same model. It also includes predictions, statistical tests, variable selection procedure and graphical tools for diagnostics and interpretation of variable effects. Currently *KSPM* is implemented for continuous dependent variables but could be extended to binary or survival outcomes.
AQuadtree: an R Package for Quadtree Anonymization of Point Data
The demand for precise data for analytical purposes grows rapidly among the research community and decision makers as more geographic information is being collected. Laws protecting data privacy are being enforced to prevent data disclosure. Statistical institutes and agencies need methods to preserve confidentiality while maintaining accuracy when disclosing geographic data. In this paper we present the AQuadtree package, a software intended to produce and deal with official spatial data making data privacy and accuracy compatible. The lack of specific methods in R to anonymize spatial data motivated the development of this package, providing an automatic aggregation tool to anonymize point data. We propose a methodology based on hierarchical geographic data structures to create a varying size grid adapted to local area population densities. This article gives insights and hints for implementation and usage. We hope this new tool may be helpful for statistical offices and users of official spatial data.
miWQS: Multiple Imputation Using Weighted Quantile Sum Regression
The *miWQS* package in the Comprehensive R Archive Network (CRAN) utilizes weighted quantile sum regression (WQS) in the multiple imputation (MI) framework. The data analyzed is a set/mixture of continuous and correlated components/chemicals that are reasonable to combine in an index and share a common outcome. These components are also interval-censored between zero and upper thresholds, or detection limits, which may differ among the components. This type of data is found in areas such as chemical epidemiological studies, sociology, and genomics. The *miWQS* package can be run using complete or incomplete data, which may be placed in the first quantile, or imputed using bootstrap or Bayesian approach. This article provides a stepwise and hands-on approach to handle uncertainty due to values below the detection limit in correlated component mixture problems.
spinifex: An R Package for Creating a Manual Tour of Low-dimensional Projections of Multivariate Data
Dynamic low-dimensional linear projections of multivariate data collectively known as *tours* provide an important tool for exploring multivariate data and models. The R package *tourr* provides functions for several types of tours: grand, guided, little, local and frozen. Each of these can be viewed dynamically, or saved into a data object for animation. This paper describes a new package, *spinifex*, which provides a manual tour of multivariate data where the projection coefficient of a single variable is controlled. The variable is rotated fully into the projection, or completely out of the projection. The resulting sequence of projections can be displayed as an animation, with functions from either the *plotly* or *gganimate* packages. By varying the coefficient of a single variable, it is possible to explore the sensitivity of structure in the projection to that variable. This is particularly useful when used with a projection pursuit guided tour to simplify and understand the solution. The use of the manual tour is applied particle physics data to illustrate the sensitivity of structure in a projection to specific variable contributions.
The Rockerverse: Packages and Applications for Containerisation with R
The Rocker Project provides widely used Docker images for R across different application scenarios. This article surveys downstream projects that build upon the Rocker Project images and presents the current state of R packages for managing Docker images and controlling containers. These use cases cover diverse topics such as package development, reproducible research, collaborative work, cloud-based data processing, and production deployment of services. The variety of applications demonstrates the power of the Rocker Project specifically and containerisation in general. Across the diverse ways to use containers, we identified common themes: reproducible environments, scalability and efficiency, and portability across clouds. We conclude that the current growth and diversification of use cases is likely to continue its positive impact, but see the need for consolidating the Rockerverse ecosystem of packages, developing common practices for applications, and exploring alternative containerisation software.
Linear Fractional Stable Motion with the rlfsm R Package
Linear fractional stable motion is a type of a stochastic integral driven by symmetric alpha-stable Lévy motion. The integral could be considered as a non-Gaussian analogue of the fractional Brownian motion. The present paper discusses R package *rlfsm* created for numerical procedures with the linear fractional stable motion. It is a set of tools for simulation of these processes as well as performing statistical inference and simulation studies on them. We introduce: tools that we developed to work with that type of motions as well as methods and ideas underlying them. Also we perform numerical experiments to show finite-sample behavior of certain estimators of the integral, and give an idea of how to envelope workflow related to the linear fractional stable motion in S4 classes and methods. Supplementary materials, including codes for numerical experiments, are available online. *rlfsm* could be found on CRAN and gitlab.
ProjectManagement: an R Package for Managing Projects
Project management is an important body of knowledge and practices that comprises the planning, organisation and control of resources to achieve one or more pre-determined objectives. In this paper, we introduce *ProjectManagement*, a new R package that provides the necessary tools to manage projects in a broad sense, and illustrate its use by examples.
gk: An R Package for the g-and-k and Generalised g-and-h Distributions
The g-and-k and (generalised) g-and-h distributions are flexible univariate distributions which can model highly skewed or heavy tailed data through only four parameters: location and scale, and two shape parameters influencing the skewness and kurtosis. These distributions have the unusual property that they are defined through their quantile function (inverse cumulative distribution function) and their density is unavailable in closed form, which makes parameter inference complicated. This paper presents the *gk* R package to work with these distributions. It provides the usual distribution functions and several algorithms for inference of independent identically distributed data, including the finite difference stochastic approximation method, which has not been used before for this problem.
Tools for Analyzing R Code the Tidy Way
With the current emphasis on reproducibility and replicability, there is an increasing need to examine how data analyses are conducted. In order to analyze the between researcher variability in data analysis choices as well as the aspects within the data analysis pipeline that contribute to the variability in results, we have created two R packages: [*matahari*](https://CRAN.R-project.org/package=matahari) and [*tidycode*](https://CRAN.R-project.org/package=tidycode). These packages build on methods created for natural language processing; rather than allowing for the processing of natural language, we focus on R code as the substrate of interest. The [*matahari*](https://CRAN.R-project.org/package=matahari) package facilitates the logging of everything that is typed in the R console or in an R script in a tidy data frame. The [*tidycode*](https://CRAN.R-project.org/package=tidycode) package contains tools to allow for analyzing R calls in a tidy manner. We demonstrate the utility of these packages as well as walk through two examples.
rcosmo: R Package for Analysis of Spherical, HEALPix and Cosmological Data
The analysis of spatial observations on a sphere is important in areas such as geosciences, physics and embryo research, just to name a few. The purpose of the package *rcosmo* is to conduct efficient information processing, visualisation, manipulation and spatial statistical analysis of Cosmic Microwave Background (CMB) radiation and other spherical data. The package was developed for spherical data stored in the Hierarchical Equal Area isoLatitude Pixelation (Healpix) representation. *rcosmo* has more than 100 different functions. Most of them initially were developed for CMB, but also can be used for other spherical data as *rcosmo* contains tools for transforming spherical data in cartesian and geographic coordinates into the HEALPix representation. We give a general description of the package and illustrate some important functionalities and benchmarks.
Variable Importance Plots---An Introduction to the vip Package
In the era of "big data", it is becoming more of a challenge to not only build state-of-the-art predictive models, but also gain an understanding of what's really going on in the data. For example, it is often of interest to know which, if any, of the predictors in a fitted model are relatively influential on the predicted outcome. Some modern algorithms---like random forests (RFs) and gradient boosted decision trees (GBMs)---have a natural way of quantifying the importance or relative influence of each feature. Other algorithms---like naive Bayes classifiers and support vector machines---are not capable of doing so and model-agnostic approaches are generally used to measure each predictor's importance. Enter *vip*, an R package for constructing variable importance scores/plots for many types of supervised learning algorithms using model-specific and novel model-agnostic approaches. We'll also discuss a novel way to display both feature importance and feature effects together using sparklines, a very small line chart conveying the general shape or variation in some feature that can be directly embedded in text or tables.
difNLR: Generalized Logistic Regression Models for DIF and DDF Detection
Differential item functioning (DIF) and differential distractor functioning (DDF) are important topics in psychometrics, pointing to potential unfairness in items with respect to minorities or different social groups. Various methods have been proposed to detect these issues. The *difNLR* `R` package extends DIF methods currently provided in other packages by offering approaches based on generalized logistic regression models that account for possible guessing or inattention, and by providing methods to detect DIF and DDF among ordinal and nominal data. In the current paper, we describe implementation of the main functions of the *difNLR* package, from data generation, through the model fitting and hypothesis testing, to graphical representation of the results. Finally, we provide a real data example to bring the concepts together.
The R package NonProbEst for estimation in non-probability surveys
Different inference procedures are proposed in the literature to correct selection bias that might be introduced with non-random sampling mechanisms. The R package [*NonProbEst*](https://CRAN.R-project.org/package=NonProbEst) enables the estimation of parameters using some of these techniques to correct selection bias in non-probability surveys. The mean and the total of the target variable are estimated using Propensity Score Adjustment, calibration, statistical matching, model-based, model-assisted and model-calibratated techniques. Confidence intervals can also obtained for each method. Machine learning algorithms can be used for estimating the propensities or for predicting the unknown values of the target variable for the non-sampled units. Variance of a given estimator is performed by two different Leave-One-Out jackknife procedures. The functionality of the package is illustrated with example data sets.
NlinTS: An R Package For Causality Detection in Time Series
The causality is an important concept that is widely studied in the literature, and has several applications, especially when modelling dependencies within complex data, such as multivariate time series. In this article, we present a theoretical description of methods from the [*NlinTS*](https://CRAN.R-project.org/package=NlinTS) package, and we focus on causality measures. The package contains the classical Granger causality test. To handle non-linear time series, we propose an extension of this test using an artificial neural network. The package includes an implementation of the Transfer entropy, which is also considered as a non-linear causality measure based on information theory. For discrete variables, we use the classical Shannon Transfer entropy, while for continuous variables, we adopt the k-nearest neighbors approach to estimate it.
SimilaR: R Code Clone and Plagiarism Detection
Third-party software for assuring source code quality is becoming increasingly popular. Tools that evaluate the coverage of unit tests, perform static code analysis, or inspect run-time memory use are crucial in the software development life cycle. More sophisticated methods allow for performing meta-analyses of large software repositories, e.g., to discover abstract topics they relate to or common design patterns applied by their developers. They may be useful in gaining a better understanding of the component interdependencies, avoiding cloned code as well as detecting plagiarism in programming classes.\ A meaningful measure of similarity of computer programs often forms the basis of such tools. While there are a few noteworthy instruments for similarity assessment, none of them turns out particularly suitable for analysing R code chunks. Existing solutions rely on rather simple techniques and heuristics and fail to provide a user with the kind of sensitivity and specificity required for working with R scripts. In order to fill this gap, we propose a new algorithm based on a Program Dependence Graph, implemented in the *SimilaR* package. It can serve as a tool not only for improving R code quality but also for detecting plagiarism, even when it has been masked by applying some obfuscation techniques or imputing dead code. We demonstrate its accuracy and efficiency in a real-world case study.
SurvBoost: An R Package for High-Dimensional Variable Selection in the Stratified Proportional Hazards Model via Gradient Boosting
High-dimensional variable selection in the proportional hazards (PH) model has many successful applications in different areas. In practice, data may involve confounding variables that do not satisfy the PH assumption, in which case the stratified proportional hazards (SPH) model can be adopted to control the confounding effects by stratification without directly modeling the confounding effects. However, there is a lack of computationally efficient statistical software for high-dimensional variable selection in the SPH model. In this work an R package, *SurvBoost*, is developed to implement the gradient boosting algorithm for fitting the SPH model with high-dimensional covariate variables. Simulation studies demonstrate that in many scenarios *SurvBoost* can achieve better selection accuracy and reduce computational time substantially compared to the existing R package that implements boosting algorithms without stratification. The proposed R package is also illustrated by an analysis of gene expression data with survival outcome in The Cancer Genome Atlas study. In addition, a detailed hands-on tutorial for *SurvBoost* is provided.
Skew-t Expected Information Matrix Evaluation and Use for Standard Error Calculations
Skew-t distributions derived from skew-normal distributions, as developed by Azzalini and several co-workers, are popular because of their theoretical foundation and the availability of computational methods in the R package *sn*. One difficulty with this skew-t family is that the elements of the expected information matrix do not have closed form analytic formulas. Thus, we developed a numerical integration method of computing the expected information matrix in the R package *skewtInfo*. The accuracy of our expected information matrix calculation method was confirmed by comparing the result with that obtained using an observed information matrix for a very large sample size. A Monte Carlo study to evaluate the accuracy of the standard errors obtained with our expected information matrix calculation method, for the case of three realistic skew-t parameter vectors, indicates that use of the expected information matrix results in standard errors as accurate as, and sometimes a little more accurate than, use of an observed information matrix.
Individual-Level Modelling of Infectious Disease Data: EpiILM
In this article we introduce the R package *EpiILM*, which provides tools for simulation from, and inference for, discrete-time individual-level models of infectious disease transmission proposed by @deardon2010. The inference is set in a Bayesian framework and is carried out via Metropolis-Hastings Markov chain Monte Carlo (MCMC). For its fast implementation, key functions are coded in Fortran. Both spatial and contact network models are implemented in the package and can be set in either susceptible-infected (SI) or susceptible-infected-removed (SIR) compartmental frameworks. Use of the package is demonstrated through examples involving both simulated and real data.
tsmp: An R Package for Time Series with Matrix Profile
This article describes [*tsmp*](https://CRAN.R-project.org/package=tsmp), an R package that implements the MP concept for TS. The [*tsmp*](https://CRAN.R-project.org/package=tsmp) package is a toolkit that allows all-pairs similarity joins, motif, discords and chains discovery, semantic segmentation, etc. Here we describe how the [*tsmp*](https://CRAN.R-project.org/package=tsmp) package may be used by showing some of the use-cases from the original articles and evaluate the algorithm speed in the R environment. This package can be downloaded at <https://CRAN.R-project.org/package=tsmp>.
npordtests: An R Package of Nonparametric Tests for Equality of Location Against Ordered Alternatives
Ordered alternatives are an important statistical problem in many situation such as increased risk of congenital malformation caused by excessive alcohol consumption during pregnancy life test experiments, drug-screening studies, dose-finding studies, the dose‐response studies, age‐related response. There are numerous other examples of this nature. In this paper, we present the *npordtests* package to test the equality of locations for ordered alternatives. The package includes the Jonckheere-Terpstra, Beier and Buning's Adaptive, Modified Jonckheere-Terpstra, Terpstra-Magel, Ferdhiana-Terpstra-Magel, KTP, S and Gaur's Gc tests. A simulation study is conducted to determine which test is the most appropriate test for which scenario and to suggest it to the researchers.
ari: The Automated R Instructor
We present the `ari` package for automatically generating technology-focused educational videos. The goal of the package is to create reproducible videos, with the ability to change and update video content seamlessly. We present several examples of generating videos including using R Markdown slide decks, PowerPoint slides, or simple images as source material. We also discuss how `ari` can help instructors reach new audiences through programmatically translating materials into other languages.
CoxPhLb: An R Package for Analyzing Length Biased Data under Cox Model
Data subject to length-biased sampling are frequently encountered in various applications including prevalent cohort studies and are considered as a special case of left-truncated data under the stationarity assumption. Many semiparametric regression methods have been proposed for length-biased data to model the association between covariates and the survival outcome of interest. In this paper, we present a brief review of the statistical methodologies established for the analysis of length-biased data under the Cox model, which is the most commonly adopted semiparametric model, and introduce an R package *CoxPhLb* that implements these methods. Specifically, the package includes features such as fitting the Cox model to explore covariate effects on survival times and checking the proportional hazards model assumptions and the stationarity assumption. We illustrate usage of the package with a simulated data example and a real dataset, the Channing House data, which are publicly available.
CopulaCenR: Copula based Regression Models for Bivariate Censored Data in R
Bivariate time-to-event data frequently arise in research areas such as clinical trials and epidemiological studies, where the occurrence of two events are correlated. In many cases, the exact event times are unknown due to censoring. The copula model is a popular approach for modeling correlated bivariate censored data, in which the two marginal distributions and the between-margin dependence are modeled separately. This article presents the [R]{.sans-serif} package [*CopulaCenR*](https://CRAN.R-project.org/package=CopulaCenR), which is designed for modeling and testing bivariate data under right or (general) interval censoring in a regression setting. It provides a variety of Archimedean copula functions including a flexible two-parameter copula and different types of regression models (parametric and semiparametric) for marginal distributions. In particular, it implements a semiparametric transformation model for the margins with proportional hazards and proportional odds models being its special cases. The numerical optimization is based on a novel two-step algorithm. For the regression parameters, three likelihood-based tests (Wald, generalized score and likelihood ratio tests) are also provided. We use two real data examples to illustrate the key functions in [*CopulaCenR*](https://CRAN.R-project.org/package=CopulaCenR).
BayesMallows: An R Package for the Bayesian Mallows Model
*BayesMallows* is an R package for analyzing preference data in the form of rankings with the Mallows rank model, and its finite mixture extension, in a Bayesian framework. The model is grounded on the idea that the probability density of an observed ranking decreases exponentially with the distance to the location parameter. It is the first Bayesian implementation that allows wide choices of distances, and it works well with a large amount of items to be ranked. *BayesMallows* handles non-standard data: partial rankings and pairwise comparisons, even in cases including non-transitive preference patterns. The Bayesian paradigm allows coherent quantification of posterior uncertainties of estimates of any quantity of interest. These posteriors are fully available to the user, and the package comes with convienient tools for summarizing and visualizing the posterior distributions.
S, R, and Data Science
Data science is increasingly important and challenging. It requires computational tools and programming environments that handle big data and difficult computations, while supporting creative, high-quality analysis. The R language and related software play a major role in computing for data science. R is featured in most programs for training in the field. R packages provide tools for a wide range of purposes and users. The description of a new technique, particularly from research in statistics, is frequently accompanied by an R package, greatly increasing the usefulness of the description.\ The history of R makes clear its connection to data science. R was consciously designed to replicate in open-source software the contents of the S software. S in turn was written by data analysis researchers at Bell Labs as part of the computing environment for research in data analysis and collaborations to apply that research, rather than as a separate project to create a programming language. The features of S and the design decisions made for it need to be understood in this broader context of supporting effective data analysis (which would now be called data science). These characteristics were all transferred to R and remain central to its effectiveness. Thus, R can be viewed as based historically on a domain-specific language for the domain of data science.\ **Note to R Journal readers:**\ The following paper was published online in the History of Programming Languages (HOPL), Volume 4, in June 2020 (DOI 10.1145/3386334). The content seems likely to be of interest to many R Journal readers, and since HOPL is plausibly not typical reading for data scientists, the editors of the R Journal have kindly offered to republish the paper here. This is possible thanks also to the enlightened policy of the ACM, providing for open distribution through the chosen copyright declaration.
Provenance of R's Gradient Optimizers
Gradient optimization methods (function minimizers) are well-represented in both the base and package universe of R [@citeR]. However, some of the methods and the codes developed from them were published before standards for hardware and software were established, in particular the IEEE arithmetic [@IEEE754A]. There have been cases of unexpected behaviour or outright errors, and these are the focus of the **histoRicalg** project. A summary history of some of the tools in R for gradient optimization methods is presented to give perspective on such methods and the occasions where they could be used effectively.
Mapping Smoothed Spatial Effect Estimates from Individual-Level Data: MapGAM
We introduce and illustrate the utility of *MapGAM*, a user-friendly R package that provides a unified framework for estimating, predicting and drawing inference on covariate-adjusted spatial effects using individual-level data. The package also facilitates visualization of spatial effects via automated mapping procedures. *MapGAM* estimates covariate-adjusted spatial associations with a univariate or survival outcome using generalized additive models that include a non-parametric bivariate smooth term of geolocation parameters. Estimation and mapping methods are implemented for continuous, discrete, and right-censored survival data. In the current manuscript, we summarize the methodology implemented in *MapGAM* and illustrate the package using two example simulated datasets: the first considering a case-control study design from the state of Massachusetts and the second considering right-censored survival data from California.
mudfold: An R Package for Nonparametric IRT Modelling of Unfolding Processes
Item response theory (IRT) models for unfolding processes use the responses of individuals to attitudinal tests or questionnaires in order to infer item and person parameters located on a latent continuum. Parametric models in this class use parametric functions to model the response process, which in practice can be restrictive. MUDFOLD (Multiple UniDimensional unFOLDing) can be used to obtain estimates of person and item ranks without imposing strict parametric assumptions on the item response functions (IRFs). This paper describes the implementation of the MUDFOLD method for binary preferential-choice data in the R package *mudfold*. The latter incorporates estimation, visualization, and simulation methods in order to provide R users with utilities for nonparametric analysis of attitudinal questionnaire data. After a brief introduction in IRT, we provide the methodological framework implemented in the package. A description of the available functions is followed by practical examples and suggestions on how this method can be used even outside the field of psychometrics.
lspartition: Partitioning-Based Least Squares Regression
Nonparametric partitioning-based least squares regression is an important tool in empirical work. Common examples include regressions based on splines, wavelets, and piecewise polynomials. This article discusses the main methodological and numerical features of the R software package *lspartition*, which implements results for partitioning-based least squares (series) regression estimation and inference from @Cattaneo-Farrell_2013_JoE and @Cattaneo-Farrell-Feng_2020_AoS. These results cover the multivariate regression function as well as its derivatives. First, the package provides data-driven methods to choose the number of partition knots optimally, according to integrated mean squared error, yielding optimal point estimation. Second, robust bias correction is implemented to combine this point estimator with valid inference. Third, the package provides estimates and inference for the unknown function both pointwise and *uniformly* in the conditioning variables. In particular, valid confidence *bands* are provided. Finally, an extension to two-sample analysis is developed, which can be used in treatment-control comparisons and related problems.
SortedEffects: Sorted Causal Effects in R
@sorted:2018 proposed the sorted effect method for nonlinear regression models. This method consists of reporting percentiles of the partial effects, the sorted effects, in addition to the average effect commonly used to summarize the heterogeneity in the partial effects. They also propose to use the sorted effects to carry out classification analysis where the observational units are classified as most and least affected if their partial effect are above or below some tail sorted effects. The R package [*SortedEffects*](https://CRAN.R-project.org/package=SortedEffects) implements the estimation and inference methods therein and provides tools to visualize the results. This vignette serves as an introduction to the package and displays basic functionality of the functions within.
The R Package trafo for Transforming Linear Regression Models
Researchers and data-analysts often use the linear regression model for descriptive, predictive, and inferential purposes. This model relies on a set of assumptions that, when not satisfied, yields biased results and noisy estimates. A common problem that can be solved in many ways -- use of less restrictive methods (e.g. generalized linear regression models or non-parametric methods ), variance corrections or transformations of the response variable just to name a few. We focus on the latter option as it allows to keep using the simple and well-known linear regression model. The list of transformations proposed in the literature is long and varies according to the problem they aim to solve. Such diversity can leave analysts lost and confused. We provide a framework implemented as an R-package, *trafo*, to help select suitable transformations depending on the user requirements and data being analyzed. The package *trafo* contains a collection of selected transformations and estimation methods that complement and increase the breadth of methods that exist in R.
BondValuation: An R Package for Fixed Coupon Bond Analysis
The purpose of this paper is to introduce the R package [*BondValuation*](https://CRAN.R-project.org/package=BondValuation) for the analysis of large datasets of fixed coupon bonds. The conceptual heterogeneity of fixed coupon bonds traded in the global markets imposes a high degree of complexity on their comparative analysis. Contrary to baseline fixed income theory, in practice, most bonds feature coupon period irregularities. In addition, there are a multitude of day count methods that determine the interest accrual, the cash flows and the discount factors used in bond valuation. Several R packages, *e.g.*, [*fBonds*](https://CRAN.R-project.org/package=fBonds), [*RQuantLib*](https://CRAN.R-project.org/package=RQuantLib), and [*YieldCurve*](https://CRAN.R-project.org/package=YieldCurve), provide tools for fixed income analysis. Nevertheless, none of them is capable of evaluating bonds featuring irregular first and/or final coupon periods, and neither provides adequate coverage of day count conventions currently used in the global bond markets. The R package *BondValuation* closes this gap using the generalized valuation methodology presented in @Djatschenko.
HCmodelSets: An R Package for Specifying Sets of Well-fitting Models in High Dimensions
In the context of regression with a large number of explanatory variables, @cox2017large emphasize that if there are alternative reasonable explanations of the data that are statistically indistinguishable, one should aim to specify as many of these explanations as is feasible. The standard practice, by contrast, is to report a single effective model for prediction. This paper illustrates the R implementation of the new ideas in the package *HCmodelSets*, using simple reproducible examples and real data. Results of some simulation experiments are also reported.
spGARCH: An R-Package for Spatial and Spatiotemporal ARCH and GARCH models
In this paper, a general overview on spatial and spatiotemporal ARCH models is provided. In particular, we distinguish between three different spatial ARCH-type models. In addition to the original definition of [@Otto16_arxiv], we introduce an logarithmic spatial ARCH model in this paper. For this new model, maximum-likelihood estimators for the parameters are proposed. In addition, we consider a new complex-valued definition of the spatial ARCH process. Moreover, spatial GARCH models are briefly discussed. From a practical point of view, the use of the R-package [*spGARCH*](https://CRAN.R-project.org/package=spGARCH) is demonstrated. To be precise, we show how the proposed spatial ARCH models can be simulated and summarize the variety of spatial models, which can be estimated by the estimation functions provided in the package. Eventually, we apply all procedures to a real-data example.
Fitting Tails by the Empirical Residual Coefficient of Variation: The ercv Package
This article is a self-contained introduction to the R package *ercv* and to the methodology on which it is based through the analysis of nine examples. The methodology is simple and trustworthy for the analysis of extreme values and relates the two main existing methodologies. The package contains R functions for visualizing, fitting and validating the distribution of tails. It also provides multiple threshold tests for a generalized Pareto distribution, together with an automatic threshold selection algorithm.
biclustermd: An R Package for Biclustering with Missing Values
Biclustering is a statistical learning technique that attempts to find homogeneous partitions of rows and columns of a data matrix. For example, movie ratings might be biclustered to group both raters and movies. *biclust* is a current R package allowing users to implement a variety of biclustering algorithms. However, its algorithms do not allow the data matrix to have missing values. We provide a new R package, *biclustermd*, which allows users to perform biclustering on numeric data even in the presence of missing values.
PPCI: an R Package for Cluster Identification using Projection Pursuit
This paper presents the R package PPCI which implements three recently proposed projec tion pursuit methods for clustering. The methods are unified by the approach of defining an optimal hyperplane to separate clusters, and deriving a projection index whose optimiser is the vector normal to this separating hyperplane. Divisive hierarchical clustering algorithms that can detect clusters defined in different subspaces are readily obtained by recursively bi-partitioning the data through such hyperplanes. Projecting onto the vector normal to the optimal hyperplane enables visualisations of the data that can be used to validate the partition at each level of the cluster hierarchy. Clustering models can also be modified in an interactive manner to improve their solutions. Extensions to problems involving clusters which are not linearly separable, and to the problem of finding maximum hard margin hyperplanes for clustering are also discussed.
Associative Classification in R: arc, arulesCBA, and rCBA
Several methods for creating classifiers based on rules discovered via association rule mining have been proposed in the literature. These classifiers are called associative classifiers and the best-known algorithm is Classification Based on Associations (CBA). Interestingly, only very few implementations are available and, until recently, no implementation was available for R. Now, three packages provide CBA. This paper introduces associative classification, the CBA algorithm, and how it can be used in R. A comparison of the three packages is provided to give the potential user an idea about the advantages of each of the implementations. We also show how the packages are related to the existing infrastructure for association rule mining already available in R.
Comparing namedCapture with other R packages for regular expressions
Regular expressions are powerful tools for manipulating non-tabular textual data. For many tasks (visualization, machine learning, etc), tables of numbers must be extracted from such data before processing by other R functions. We present the R package [*namedCapture*](https://CRAN.R-project.org/package=namedCapture), which facilitates such tasks by providing a new user-friendly syntax for defining regular expressions in R code. We begin by describing the history of regular expressions and their usage in R. We then describe the new features of the namedCapture package, and provide detailed comparisons with related R packages ([*rex*](https://CRAN.R-project.org/package=rex), [*stringr*](https://CRAN.R-project.org/package=stringr), [*stringi*](https://CRAN.R-project.org/package=stringi), [*tidyr*](https://CRAN.R-project.org/package=tidyr), [*rematch2*](https://CRAN.R-project.org/package=rematch2), [*re2r*](https://CRAN.R-project.org/package=re2r)).
Resampling-Based Analysis of Multivariate Data and Repeated Measures Designs with the R Package MANOVA.RM
Nonparametric statistical inference methods for a modern and robust analysis of longitudinal and multivariate data in factorial experiments are essential for research. While existing approaches that rely on specific distributional assumptions of the data (multivariate normality and/or equal covariance matrices) are implemented in statistical software packages, there is a need for user-friendly software that can be used for the analysis of data that do not fulfill the aforementioned assumptions and provide accurate $p$ value and confidence interval estimates. Therefore, newly developed nonparametric statistical methods based on bootstrap- and permutation-approaches, which neither assume multivariate normality nor specific covariance matrices, have been implemented in the freely available R package *MANOVA.RM*. The package is equipped with a graphical user interface for plausible applications in academia and other educational purpose. Several motivating examples illustrate the application of the methods.
lpirfs: An R Package to Estimate Impulse Response Functions by Local Projections
Impulse response analysis is a cornerstone in applied (macro-)econometrics. Estimating impulse response functions using local projections (LPs) has become an appealing alternative to the traditional structural vector autoregressive (SVAR) approach. Despite its growing popularity and applications, however, no R package yet exists that makes this method available. In this paper, I introduce *lpirfs*, a fast and flexible R package that provides a broad framework to compute and visualize impulse response functions using LPs for a variety of data sets.
mistr: A Computational Framework for Mixture and Composite Distributions
Finite mixtures and composite distributions allow to model the probabilistic representation of data with more generality than simple distributions and are useful to consider in a wide range of applications. The R package *mistr* provides an extensible computational framework for creating, transforming, and evaluating these models, together with multiple methods for their visualization and description. In this paper we present the main computational framework of the package and illustrate its application. In addition, we provide and show functions for data modeling using two specific composite distributions as well as a numerical example where a composite distribution is estimated to describe the log-returns of selected stocks.
coxed: An R Package for Computing Duration-Based Quantities from the Cox Proportional Hazards Model
The Cox proportional hazards model is one of the most frequently used estimators in duration (survival) analysis. Because it is estimated using only the observed durations' rank ordering, typical quantities of interest used to communicate results of the Cox model come from the hazard function (e.g., hazard ratios or percentage changes in the hazard rate). These quantities are substantively vague and difficult for many audiences of research to understand. We introduce a suite of methods in the R package *coxed* to address these problems. The package allows researchers to calculate duration-based quantities from Cox model results, such as the expected duration (or survival time) given covariate values and marginal changes in duration for a specified change in a covariate. These duration-based quantities often match better with researchers' substantive interests and are easily understood by most readers. We describe the methods and illustrate use of the package.
The IDSpatialStats R Package: Quantifying Spatial Dependence of Infectious Disease Spread
Spatial statistics for infectious diseases are important because the spatial and temporal scale over which transmission operates determine the dynamics of disease spread. Many methods for quantifying the distribution and clustering of spatial point patterns have been developed (e.g. $K$-function and pair correlation function) and are routinely applied to infectious disease case occurrence data. However, these methods do not explicitly account for overlapping chains of transmission and require knowledge of the underlying population distribution, which can be limiting when analyzing epidemic case occurrence data. Therefore, we developed two novel spatial statistics that account for these effects to estimate: 1) the mean of the spatial transmission kernel, and 2) the $\tau$-statistic, a measure of global clustering based on pathogen subtype. We briefly introduce these statistics and show how to implement them using the IDSpatialStats R package.
Fixed Point Acceleration in R
A fixed point problem is one where we seek a vector, X, for a function, f, such that f(X) = X. The solution of many such problems can be accelerated by using a fixed point acceleration algorithm. With the release of the *FixedPoint* package there is now a number of algorithms available in **R** that can be used for accelerating the finding of a fixed point of a function. These algorithms include Newton acceleration, Aitken acceleration and Anderson acceleration as well as epsilon extrapolation methods and minimal polynomial methods. This paper demonstrates the use of fixed point accelerators in solving numerical mathematics problems using the algorithms of the *FixedPoint* package as well as the squarem method of the *SQUAREM* package.
SemiCompRisks: An R Package for the Analysis of Independent and Cluster-correlated Semi-competing Risks Data
Semi-competing risks refer to the setting where primary scientific interest lies in estimation and inference with respect to a non-terminal event, the occurrence of which is subject to a terminal event. In this paper, we present the R package **SemiCompRisks** that provides functions to perform the analysis of independent/clustered semi-competing risks data under the illness-death multi-state model. The package allows the user to choose the specification for model components from a range of options giving users substantial flexibility, including: accelerated failure time or proportional hazards regression models; parametric or non-parametric specifications for baseline survival functions; parametric or non-parametric specifications for random effects distributions when the data are cluster-correlated; and, a Markov or semi-Markov specification for terminal event following non-terminal event. While estimation is mainly performed within the Bayesian paradigm, the package also provides the maximum likelihood estimation for select parametric models. The package also includes functions for univariate survival analysis as complementary analysis tools.
RSSampling: A Pioneering Package for Ranked Set Sampling
Ranked set sampling (RSS) is an advanced data collection method when the exact measurement of an observation is difficult and/or expensive used in a number of research areas, e.g., environment, bioinformatics, ecology, etc. In this method, random sets are drawn from a population and the units in sets are ranked with a ranking mechanism which is based on a visual inspection or a concomitant variable. Because of the importance of working with a good design and easy analysis, there is a need for a software tool which provides sampling designs and statistical inferences based on RSS and its modifications. This paper introduces an R package as a free and easy-to-use analysis tool for both sampling processes and statistical inferences based on RSS and its modified versions. For researchers, the *RSSampling* package provides a sample with RSS, extreme RSS, median RSS, percentile RSS, balanced groups RSS, double versions of RSS, L-RSS, truncation-based RSS, and robust extreme RSS when the judgment rankings are both perfect and imperfect. Researchers can also use this new package to make parametric inferences for the population mean and the variance where the sample is obtained via classical RSS. Moreover, this package includes applications of the nonparametric methods which are one sample sign test, Mann-Whitney-Wilcoxon test, and Wilcoxon signed-rank test procedures. The package is available as *RSSampling* on CRAN.
unival: An FA-based R Package For Assessing Essential Unidimensionality Using External Validity Information
The *unival* package is designed to help researchers decide between unidimensional and correlated-factors solutions in the factor analysis of psychometric measures. The novelty of the approach is its use of *external* information, in which multiple factor scores and general factor scores are related to relevant external variables or criteria. The *unival* package's implementation comes from a series of procedures put forward by @FerrandoLorenzo-Seva:2019 and new methodological developments proposed in this article. We assess models fitted using *unival* by means of a simulation study extending the results obtained in the original proposal. Its usefulness is also assessed through a real-world data example. Based on these results, we conclude *unival* is a valuable tool for use in applications in which the dimensionality of an item set is to be assessed.
BINCOR: An R package for Estimating the Correlation between Two Unevenly Spaced Time Series
This paper presents a computational program named *BINCOR* (BINned CORrelation) for estimating the correlation between two unevenly spaced time series. This program is also applicable to the situation of two evenly spaced time series not on the same time grid. *BINCOR* is based on a novel estimation approach proposed by [@mudelsee_2010] for estimating the correlation between two climate time series with different timescales. The idea is that autocorrelation (e.g. an AR1 process) means that memory enables values obtained on different time points to be correlated. Binned correlation is performed by resampling the time series under study into time bins on a regular grid, assigning the mean values of the variable under scrutiny within those bins. We present two examples of our *BINCOR* package with real data: instrumental and paleoclimatic time series. In both applications *BINCOR* works properly in detecting well-established relationships between the climate records compared.
auditor: an R Package for Model-Agnostic Visual Validation and Diagnostics
Machine learning models have successfully been applied to challenges in applied in biology, medicine, finance, physics, and other fields. With modern software it is easy to train even a complex model that fits the training data and results in high accuracy on test set. However, problems often arise when models are confronted with the real-world data. This paper describes methodology and tools for model-agnostic auditing. It provides functinos for assessing and comparing the goodness of fit and performance of models. In addition, the package may be used for analysis of the similarity of residuals and for identification of outliers and influential observations. The examination is carried out by diagnostic scores and visual verification. The code presented in this paper are implemented in the [*auditor*](https://CRAN.R-project.org/package=auditor) package. Its flexible and consistent grammar facilitates the validation models of a large class of models.
shadow: R Package for Geometric Shadow Calculations in an Urban Environment
This paper introduces the *shadow* package for R. The package provides functions for shadow-related calculations in the urban environment, namely shadow height, shadow footprint and Sky View Factor (SVF) calculations, as well as a wrapper function to estimate solar radiation while taking shadow effects into account. All functions operate on a layer of polygons with a height attribute, also known as "extruded polygons" or 2.5D vector data. Such data are associated with accuracy limitations in representing urban environments. However, unlike 3D models, polygonal layers of building outlines along with their height are abundantly available and their processing does not require specialized closed-source 3D software. The present package thus brings spatio-temporal shadow, SVF and solar radiation calculation capabilities to the open-source spatial analysis workflow in R. Package functionality is demonstrated using small reproducible examples for each function. Wider potential use cases include urban environment applications such as evaluation of micro-climatic influence for urban planning, studying urban climatic comfort and estimating photovoltaic energy production potential.
Integration of networks and pathways with StarBioTrek package
High-throughput genomic technologies bring to light a comprehensive hallmark of molecular changes of a disease. It is increasingly evident that genes are not isolated from each other and the identification of a gene signature can only partially elucidate the de-regulated biological functions in a disease. The comprehension of how groups of genes (pathways) are related to each other (pathway-cross talk) could explain biological mechanisms causing diseases. Biological pathways are important tools to identify gene interactions and decrease the large number of genes to be studied by partitioning them into smaller groups. Furthermore, recent scientific studies have demonstrated that an integration of pathways and networks, instead of a single component of the pathway or a single network, could lead to a deeper understanding of the pathology.\ *StarBioTrek* is an R package for the integration of biological pathways and networks which provides a series of functions to support the user in their analyses. In particular, it implements algorithms to identify pathways cross-talk networks and gene network drivers in pathways. It is available as open source and open development software in the Bioconductor platform.
ciuupi: An R package for Computing Confidence Intervals that Utilize Uncertain Prior Information
We have created the R package *ciuupi* to compute confidence intervals that utilize uncertain prior information in linear regression. Unlike post-model-selection confidence intervals, the confidence interval that utilizes uncertain prior information (CIUUPI) implemented in this package has, to an excellent approximation, coverage probability throughout the parameter space that is very close to the desired minimum coverage probability. Furthermore, when the uncertain prior information is correct, the CIUUPI is, on average, shorter than the standard confidence interval constructed using the full linear regression model. In this paper we provide motivating examples of scenarios where the CIUUPI may be used. We then give a detailed description of this interval and the numerical constrained optimization method implemented in R to obtain it. Lastly, using a real data set as an illustrative example, we show how to use the functions in *ciuupi*.
cvcrand: A Package for Covariate-constrained Randomization and the Clustered Permutation Test for Cluster Randomized Trials
The cluster randomized trial (CRT) is a randomized controlled trial in which randomization is conducted at the cluster level (e.g., school or hospital) and outcomes are measured for each individual within a cluster. Often, the number of clusters available to randomize is small ($\leq$ 20), which increases the chance of baseline covariate imbalance between comparison arms. Such imbalance is particularly problematic when the covariates are predictive of the outcome because it can threaten the internal validity of the CRT. Pair-matching and stratification are two restricted randomization approaches that are frequently used to ensure balance at the design stage. An alternative, less commonly-used restricted randomization approach is covariate-constrained randomization. Covariate-constrained randomization quantifies baseline imbalance of cluster-level covariates using a balance metric and randomly selects a randomization scheme from those with acceptable balance by the balance metric. It is able to accommodate multiple covariates, both categorical and continuous. To facilitate implementation of covariate-constrained randomization for the design of two-arm parallel CRTs, we have developed the *cvcrand* R package. In addition, *cvcrand* also implements the clustered permutation test for analyzing continuous and binary outcomes collected from a CRT designed with covariate-constrained randomization. We used a real cluster randomized trial to illustrate the functions included in the package.
jomo: A Flexible Package for Two-level Joint Modelling Multiple Imputation
Multiple imputation is a tool for parameter estimation and inference with partially observed data, which is used increasingly widely in medical and social research. When the data to be imputed are correlated or have a multilevel structure --- repeated observations on patients, school children nested in classes within schools within educational districts --- the imputation model needs to include this structure. Here we introduce our **jo**int **mo**delling package for multiple imputation of multilevel data, [*jomo*](https://CRAN.R-project.org/package=jomo), which uses a multivariate normal model fitted by Markov Chain Monte Carlo (MCMC). Compared to previous packages for multilevel imputation, e.g. [*pan*](https://CRAN.R-project.org/package=pan), *jomo* adds the facility to (i) handle and impute categorical variables using a latent normal structure, (ii) impute level-2 variables, and (iii) allow for cluster-specific covariance matrices, including the option to give them an inverse-Wishart distribution at level 2. The package uses C routines to speed up the computations and has been extensively validated in simulation studies both by ourselves and others.
ipwErrorY: An R Package for Estimation of Average Treatment Effect with Misclassified Binary Outcome
It has been well documented that ignoring measurement error may result in severely biased inference results. In recent years, there has been limited but increasing research on causal inference with measurement error. In the presence of misclassified binary outcome variable, [@ShuYi2017] considered the inverse probability weighted estimation of the average treatment effect and proposed valid estimation methods to correct for misclassification effects for various settings. To expedite the application of those methods for situations where misclassification in the binary outcome variable is a real concern, we implement correction methods proposed by [@ShuYi2017] and develop an R package *ipwErrorY* for general users. Simulated datasets are used to illustrate the use of the developed package.
optimParallel: An R Package Providing a Parallel Version of the L-BFGS-B Optimization Method
The R package *optimParallel* provides a parallel version of the L-BFGS-B optimization method of `optim()`. The main function of the package is `optimParallel()`, which has the same usage and output as `optim()`. Using `optimParallel()` can significantly reduce the optimization time, especially when the evaluation time of the objective function is large and no analytical gradient is available. We introduce the R package and illustrate its implementation, which takes advantage of the lexical scoping mechanism of R.
swgee: An R Package for Analyzing Longitudinal Data with Response Missingness and Covariate Measurement Error
Though longitudinal data often contain missing responses and error-prone covariates, relatively little work has been available to simultaneously correct for the effects of response missingness and covariate measurement error on analysis of longitudinal data. @r26 proposed a simulation based marginal method to adjust for the bias induced by measurement error in covariates as well as by missingness in response. The proposed method focuses on modeling the marginal mean and variance structures, and the missing at random mechanism is assumed. Furthermore, the distribution of covariates are left unspecified. These features make the proposed method applicable to a broad settings. In this paper, we develop an R package, called *swgee*, which implements the method proposed by @r26. Moreover, our package includes additional implementation steps which extend the setting considered by @r26. To describe the use of the package and its main features, we report simulation studies and analyses of a data set arising from the Framingham Heart Study.
roahd Package: Robust Analysis of High Dimensional Data
The focus of this paper is on the open-source R package *roahd* (**RO**bust **A**nalysis of **H**igh dimensional **D**ata), see [@roahd]. *roahd* has been developed to gather recently proposed statistical methods that deal with the robust inferential analysis of univariate and multivariate functional data. In particular, efficient methods for outlier detection and related graphical tools, methods to represent and simulate functional data, as well as inferential tools for testing differences and dependency among families of curves will be discussed, and the associated functions of the package will be described in details.
The Landscape of R Packages for Automated Exploratory Data Analysis
The increasing availability of large but noisy data sets with a large number of heterogeneous variables leads to the increasing interest in the automation of common tasks for data analysis. The most time-consuming part of this process is the Exploratory Data Analysis, crucial for better domain understanding, data cleaning, data validation, and feature engineering.\ There is a growing number of libraries that attempt to automate some of the typical Exploratory Data Analysis tasks to make the search for new insights easier and faster. In this paper, we present a systematic review of existing tools for Automated Exploratory Data Analysis (autoEDA). We explore the features of fifteen popular R packages to identify the parts of analysis that can be effectively automated with the current tools and to point out new directions for further autoEDA development.
MDFS: MultiDimensional Feature Selection in R
Identification of informative variables in an information system is often performed using simple one-dimensional filtering procedures that discard information about interactions between variables. Such an approach may result in removing some relevant variables from consideration. Here we present an R package *MDFS* (MultiDimensional Feature Selection) that performs identification of informative variables taking into account synergistic interactions between multiple descriptors and the decision variable. *MDFS* is an implementation of an algorithm based on information theory [@DBLP:journals/corr/MnichR17]. The computational kernel of the package is implemented in C++. A high-performance version implemented in CUDA C is also available. The application of *MDFS* is demonstrated using the well-known Madelon dataset, in which a decision variable is generated from synergistic interactions between descriptor variables. It is shown that the application of multidimensional analysis results in better sensitivity and ranking of importance.
Nowcasting: An R Package for Predicting Economic Variables Using Dynamic Factor Models
The [*nowcasting*](https://CRAN.R-project.org/package=nowcasting) package provides the tools to make forecasts of monthly or quarterly economic variables using dynamic factor models. The objective is to help the user at each step of the forecasting process, starting with the construction of a database, all the way to the interpretation of the forecasts. The dynamic factor model adopted in this package is based on the articles from @giannoneetal2008 and @banburaetal2011. Although there exist several other dynamic factor model packages available for R, ours provides an environment to easily forecast economic variables and interpret results.
ConvergenceClubs: A Package for Performing the Phillips and Sul's Club Convergence Clustering Procedure
This paper introduces package ConvergenceClubs, which implements functions to perform the @PhillipsSul2007 [@PhillipsSul2009] club convergence clustering procedure in a simple and reproducible manner. The approach proposed by Phillips and Sul to analyse the convergence patterns of groups of economies is formulated as a nonlinear time varying factor model that allows for different time paths as well as individual heterogeneity. Unlike other approaches in which economies are grouped a priori, it also allows the endogenous determination of convergence clubs. The algorithm, usage, and implementation details are discussed.
SimCorrMix: Simulation of Correlated Data with Multiple Variable Types Including Continuous and Count Mixture Distributions
The *SimCorrMix* package generates correlated continuous (normal, non-normal, and mixture), binary, ordinal, and count (regular and zero-inflated, Poisson and Negative Binomial) variables that mimic real-world data sets. Continuous variables are simulated using either Fleishman's third-order or Headrick's fifth-order power method transformation. Simulation occurs at the component level for continuous mixture distributions, and the target correlation matrix is specified in terms of correlations with components. However, the package contains functions to approximate expected correlations with continuous mixture variables. There are two simulation pathways which calculate intermediate correlations involving count variables differently, increasing accuracy under a wide range of parameters. The package also provides functions to calculate cumulants of continuous mixture distributions, check parameter inputs, calculate feasible correlation boundaries, and summarize and plot simulated variables. *SimCorrMix* is an important addition to existing R simulation packages because it is the first to include continuous mixture and zero-inflated count variables in correlated data sets.
Time-Series Clustering in R Using the dtwclust Package
Most clustering strategies have not changed considerably since their initial definition. The common improvements are either related to the distance measure used to assess dissimilarity, or the function used to calculate prototypes. Time-series clustering is no exception, with the Dynamic Time Warping distance being particularly popular in that context. This distance is computationally expensive, so many related optimizations have been developed over the years. Since no single clustering algorithm can be said to perform best on all datasets, different strategies must be tested and compared, so a common infrastructure can be advantageous. In this manuscript, a general overview of shape-based time-series clustering is given, including many specifics related to Dynamic Time Warping and associated techniques. At the same time, a description of the [*dtwclust*](https://CRAN.R-project.org/package=dtwclust) package for the R statistical software is provided, showcasing how it can be used to evaluate many different time-series clustering procedures.
mixedsde: A Package to Fit Mixed Stochastic Differential Equations
Stochastic differential equations (SDEs) are useful to model continuous stochastic processes. When (independent) repeated temporal data are available, variability between the trajectories can be modeled by introducing random effects in the drift of the SDEs. These models are useful to analyze neuronal data, crack length data, pharmacokinetics, financial data, to cite some applications among other. The `R` package focuses on the estimation of SDEs with linear random effects in the drift. The goal is to estimate the common density of the random effects from repeated discrete observations of the SDE. The package *mixedsde* proposes three estimation methods: a Bayesian parametric, a frequentist parametric and a frequentist nonparametric method. The three procedures are described as well as the main functions of the package. Illustrations are presented on simulated and real data.
Indoor Positioning and Fingerprinting: The R Package ipft
Methods based on Received Signal Strength Indicator (RSSI) fingerprinting are in the forefront among several techniques being proposed for indoor positioning. This paper introduces the R package [*ipft*](https://CRAN.R-project.org/package=ipft), which provides algorithms and utility functions for indoor positioning using fingerprinting techniques. These functions are designed for manipulation of RSSI fingerprint data sets, estimation of positions, comparison of the performance of different positioning models, and graphical visualization of data. Well-known machine learning algorithms are implemented in this package to perform analysis and estimations over RSSI data sets. The paper provides a description of these algorithms and functions, as well as examples of its use with real data. The [*ipft*](https://CRAN.R-project.org/package=ipft) package provides a base that we hope to grow into a comprehensive library of fingerprinting-based indoor positioning methodologies.
RobustGaSP: Robust Gaussian Stochastic Process Emulation in R
Gaussian stochastic process (GaSP) emulation is a powerful tool for approximating computationally intensive computer models. However, estimation of parameters in the GaSP emulator is a challenging task. No closed-form estimator is available and many numerical problems arise with standard estimates, e.g., the maximum likelihood estimator. In this package, we implement a marginal posterior mode estimator, for special priors and parameterizations. This estimation method that meets the robust parameter estimation criteria was discussed in [@Gu2018robustness]; mathematical reasons are provided therein to explain why robust parameter estimation can greatly improve predictive performance of the emulator. In addition, inert inputs (inputs that almost have no effect on the variability of a function) can be identified from the marginal posterior mode estimation at no extra computational cost. The package also implements the parallel partial Gaussian stochastic process (PP GaSP) emulator ([@gu2016parallel]) for the scenario where the computer model has multiple outputs on, for example, spatial-temporal coordinates. The package can be operated in a default mode, but also allows numerous user specifications, such as the capability of specifying trend functions and noise terms. Examples are studied herein to highlight the performance of the package in terms of out-of-sample prediction.
What's for dynr: A Package for Linear and Nonlinear Dynamic Modeling in R
Intensive longitudinal data in the behavioral sciences are often noisy, multivariate in nature, and may involve multiple units undergoing regime switches by showing discontinuities interspersed with continuous dynamics. Despite increasing interest in using linear and nonlinear differential/difference equation models with regime switches, there has been a scarcity of software packages that are fast and freely accessible. We have created an R package called *dynr* that can handle a broad class of linear and nonlinear discrete- and continuous-time models, with regime-switching properties and linear Gaussian measurement functions, in C, while maintaining simple and easy-to-learn model specification functions in R. We present the mathematical and computational bases used by the *dynr* R package, and present two illustrative examples to demonstrate the unique features of *dynr*.
Identifying and Testing Recursive vs. Interdependent Links in Simultaneous Equation Models via the SIRE Package
Simultaneous equation models (SEMs) are composed of relations which either represent unidirectional links, which entail a causal interpretation, or bidirectional links, due to feedback loops, which lead to the notion of interdependence. The issue is of prominent interest in several respects. Investigating the causal structure of a SEM, on the one hand, brings to light the theoretical assumptions behind the model and, on the other hand, pilots the choice of the befitting estimation method and of which policy to implement.\ This paper provides an operational method to distinguish causal relations from interdependent ones in SEMs, such as macro-econometric models, models in ecology, biology, demography, and so forth. It is shown that the causal structure of a system crucially rests on the feedback loops, which possibly affect the equations. These loops are associated to the non-null entries of the Hadamard product of matrices encoding the direct and indirect links among the SEM dependent variables. The effectiveness of feedbacks is verified with a Wald test based on the significance of the aforementioned non-null entries.\ An R package, *SIRE* (System of Interdependent/Recursive Equations), provides the operational completion of the methodological and analytic results of the paper. *SIRE* is applied to a macroeconomic model to illustrate how this type of analysis proves useful in clarifying the nature of the complex relations in SEMs.
fclust: An R Package for Fuzzy Clustering
Fuzzy clustering methods discover fuzzy partitions where observations can be softly assigned to more than one cluster. The package *fclust* is a toolbox for fuzzy clustering in the R programming language. It not only implements the widely used fuzzy $k$-means (F$k$M) algorithm, but also many F$k$M variants. Fuzzy cluster similarity measures, cluster validity indices and cluster visualization tools are also offered. In the current version, all the functions are rewritten in the C++ language allowing their application in large-size problems. Moreover, new fuzzy relational clustering algorithms for partitioning qualitative/mixed data are provided together with an improved version of the so-called Gustafson-Kessel algorithm to avoid singularity in the cluster covariance matrices. Finally, it is now possible to automatically select the number of clusters by means of the available fuzzy cluster validity indices.
Matching with Clustered Data: the CMatching Package in R
Matching is a well known technique to balance covariates distribution between treated and control units in non-experimental studies. In many fields, clustered data are a very common occurrence in the analysis of observational data and the clustering can add potentially interesting information. Matching algorithms should be adapted to properly exploit the hierarchical structure. In this article we present the CMatching package implementing matching algorithms for clustered data. The package provides functions for obtaining a matched dataset along with estimates of most common parameters of interest and model-based standard errors. A propensity score matching analysis, relating math proficiency with homework completion for students belonging to different schools (based on the NELS-88 data), illustrates in detail the use of the algorithms.
Connecting R with D3 for dynamic graphics, to explore multivariate data with tours
The [*tourr*](https://CRAN.R-project.org/package=tourr) package in R has several algorithms and displays for showing multivariate data as a sequence of low-dimensional projections. It can display as a movie but has no capacity for interaction, such as stop/go, change tour type, drop/add variables. The [*tourrGui*](https://CRAN.R-project.org/package=tourrGui) package provides these sorts of controls, but the interface is programmed with the dated [*RGtk2*](https://CRAN.R-project.org/package=RGtk2) package. This work explores using custom messages to pass data from R to D3 for viewing, using the Shiny framework. This is an approach that can be generally used for creating all sorts of interactive graphics.\
dr4pl: A Stable Convergence Algorithm for the 4 Parameter Logistic Model
The *4 Parameter Logistic* (*4PL*) *model* has been recognized as a major tool to analyze the relationship between doses and responses in pharmacological experiments. A main strength of this model is that each parameter contributes an intuitive meaning enhancing interpretability of a fitted model. However, implementing the 4PL model using conventional statistical software often encounters numerical errors. This paper highlights the issue of convergence failure and presents several causes with solutions. These causes include outliers and a non-logistic data shape, so useful remedies such as robust estimation, outlier diagnostics and constrained optimization are proposed. These features are implemented in a new R package dr4pl (Dose-Response analysis using the 4 Parameter Logistic model) whose code examples are presented as a separate section. Our R package dr4pl is shown to work well for data sets where the traditional dose-response modelling packages drc and nplr fail.
Time Series Forecasting with KNN in R: the tsfknn Package
In this paper the *tsfknn* package for time series forecasting using $k$-nearest neighbor regression is described. This package allows users to specify a KNN model and to generate its forecasts. The user can choose among different multi-step ahead strategies and among different functions to aggregate the targets of the nearest neighbors. It is also possible to assess the forecast accuracy of the KNN model.
rollmatch: An R Package for Rolling Entry Matching
The gold standard of experimental research is the randomized control trial. However, interventions are often implemented without a randomized control group for practical or ethical reasons. Propensity score matching (PSM) is a popular method for minimizing the effects of a randomized experiment from observational data by matching members of a treatment group to similar candidates that did not receive the intervention. Traditional PSM is not designed for studies that enroll participants on a rolling basis and does not provide a solution for interventions in which the baseline and intervention period are undefined in the comparison group. Rolling Entry Matching (REM) is a new matching method that addresses both issues. REM selects comparison members who are similar to intervention members with respect to both static (e.g., race) and dynamic (e.g., health conditions) characteristics. This paper will discuss the key components of REM and introduce the [*rollmatch*](https://CRAN.R-project.org/package=rollmatch) R package.
orthoDr: Semiparametric Dimension Reduction via Orthogonality Constrained Optimization
[*orthoDr*](https://CRAN.R-project.org/package=orthoDr) is a package in R that solves dimension reduction problems using orthogonality constrained optimization approach. The package serves as a unified framework for many regression and survival analysis dimension reduction models that utilize semiparametric estimating equations. The main computational machinery of *orthoDr* is a first-order algorithm developed by [@wen2013feasible] for optimization within the Stiefel manifold. We implement the algorithm through Rcpp and OpenMP for fast computation. In addition, we developed a general-purpose solver for such constrained problems with user-specified objective functions, which works as a drop-in version of optim(). The package also serves as a platform for future methodology developments along this line of work.
Modeling regimes with extremes: the bayesdfa package for identifying and forecasting common trends and anomalies in multivariate time-series data
The *bayesdfa* package provides a flexible Bayesian modeling framework for applying dynamic factor analysis (DFA) to multivariate time-series data as a dimension reduction tool. The core estimation is done with the Stan probabilistic programming language. In addition to being one of the few Bayesian implementations of DFA, novel features of this model include (1) optionally modeling latent process deviations as drawn from a Student-t distribution to better model extremes, and (2) optionally including autoregressive and moving-average components in the latent trends. Besides estimation, we provide a series of plotting functions to visualize trends, loadings, and model predicted values. A secondary analysis for some applications is to identify regimes in latent trends. We provide a flexible Bayesian implementation of a Hidden Markov Model --- also written with Stan --- to characterize regime shifts in latent processes. We provide simulation testing and details on parameter sensitivities in supplementary information.
Optimization Routines for Enforcing One-to-One Matches in Record Linkage Problems
Record linkage aims at quickly and accurately identifying if two records represent the same real world entity. In many applications, we are interested in restricting the linkage results to \"1 to 1\" links, that is a single record does not appear more than once in the output. This can be dealt with the transport algorithm. The optimization problem, however, grows quadratically in the size of the input, quickly becoming untreatable for cases with a few thousand records. This paper compares different solutions, provided by some R packages for linear programming solvers. The comparison is done in terms of memory usage and execution time. The aim is to overcome the current implementation in the toolkit RELAIS, specifically developed for record linkage problems. The results highlight improvements beyond expectations. In fact the tested solutions allow successfully executing the \"1 to 1\" reduction for large size datasets up to the largest sample surveys at National Statistical Institutes.
Using Web Services to Work with Geodata in R
Through collaborative mapping, a massive amount of data is accessible. Many individuals contribute information each day. The growing amount of geodata is gathered by volunteers or obtained via crowd-sourcing. One outstanding example of this is the OpenStreetMap (OSM) Project which provides access to big data in geography. Another online mapping service that enables the integration of geodata into the analysis is Google Maps. The expanding content and the availability of geographic information radically changes the perspective on geodata (@chilton2009crowdsourcing). Recently many application programming interfaces (APIs) have been built on OSM and Google Maps. That leads to a point where it is possible to access sections of geographical information without the usage of a complex database solution, especially if one only requires a small data section for a visualization.\ First tools for spatial analysis have been included in the R language very early [@bivand2000implementing] and this development will continue to accelerate, underpinning a continual change. Notably, in recent years many tools have been developed to enable the usage of R as a geographic information system (GIS). With a GIS it is possible to process spatial data. QuantumGIS (QGIS) is a free software solution for these tasks, and a user interface is available for this purpose. R is, therefore, an alternative to geographic information systems like QGIS (@QGIS_software). Besides, add-ins for QGIS and R-packages ([*RQGIS*](https://CRAN.R-project.org/package=RQGIS)) are available, that enables the combination of R and QGIS (@ma:rqgis). It is the target of this article to present some of the most important R-functionalities to download and process geodata from OSM and the Google Maps API. The focus of this paper is on functions that enable the natural usage of these APIs.
atable: Create Tables for Clinical Trial Reports
Examining distributions of variables is the first step in the analysis of a clinical trial before more specific modelling can begin. Reporting these results to stakeholders of the trial is an essential part of a statistician's work. The *atable* package facilitates these steps by offering easy-to-use but still flexible functions.
idmTPreg: Regression Model for Progressive Illness Death Data
The progressive illness-death model is frequently used in medical applications. For example, the model may be used to describe the disease process in cancer studies. We have developed a new R package called *idmTPreg* to estimate regression coefficients in datasets that can be described by the progressive illness-death model. The motivation for the development of the package is a recent contribution that enables the estimation of possibly time-varying covariate effects on the transition probabilities for a progressive illness-death data. The main feature of the package is that it befits both non-Markov and Markov progressive illness-death data. The package implements the introduced estimators obtained using a direct binomial regression approach. Also, variance estimates and confidence bands are implemented in the package. This article presents guidelines for the use of the package.
Dynamic Simulation and Testing for Single-Equation Cointegrating and Stationary Autoregressive Distributed Lag Models
While autoregressive distributed lagmodels allow for extremely flexible dynamics, interpreting the substantive significance of complex lag structures remains difficult. In this paper we discuss *dynamac* (dynamic autoregressive and cointegrating models), an `R` package designed to assist users in estimating, dynamically simulating, and plotting the results of a variety of autoregressive distributed lagmodels. It also contains a number of post-estimation diagnostics, including a test for cointegration for when researchers are estimating the error-correction variant of the autoregressive distributed lagmodel.
ShinyItemAnalysis for Teaching Psychometrics and to Enforce Routine Analysis of Educational Tests
This work introduces *ShinyItemAnalysis*, an R package and an online shiny application for psychometric analysis of educational tests and items. *ShinyItemAnalysis* covers a broad range of psychometric methods and offers data examples, model equations, parameter estimates, interpretation of results, together with a selected R code, and is therefore suitable for teaching psychometric concepts with R. Furthermore, the application aspires to be an easy-to-use tool for analysis of educational tests by allowing the users to upload and analyze their own data and to automatically generate analysis reports in PDF or HTML. We argue that psychometric analysis should be a routine part of test development in order to gather proofs of reliability and validity of the measurement, and we demonstrate how *ShinyItemAnalysis* may help enforce this goal.
Measurement Errors in R
This paper presents an R package to handle and represent measurements with errors in a very simple way. We briefly introduce the main concepts of metrology and propagation of uncertainty, and discuss related R packages. Building upon this, we introduce the *errors* package, which provides a class for associating uncertainty metadata, automated propagation and reporting. Working with *errors* enables transparent, lightweight, less error-prone handling and convenient representation of measurements with errors. Finally, we discuss the advantages, limitations and future work of computing with errors.
SARIMA Analysis and Automated Model Reports with BETS, an R Package
This article aims to demonstrate how the powerful features of the R package *BETS* can be applied to SARIMA time series analysis. *BETS* provides not only thousands of Brazilian economic time series from different institutions, but also a range of analytical tools, and educational resources. In particular, *BETS* is capable of generating automated model reports for any given time series. These reports rely on a single function call and are able to build three types of models (SARIMA being one of them). The functions need few inputs and output rich content. The output varies according to the inputs and usually consists of a summary of the series properties, step-by-step explanations on how the model was developed, predictions made by the model, and a file containing these predictions. This work focuses on this feature and several other *BETS* functions that are designed to help in modeling time series. We present them in a thorough case study: the SARIMA approach to model and forecast the Brazilian production of intermediate goods index series.
Explanations of Model Predictions with live and breakDown Packages
Complex models are commonly used in predictive modeling. In this paper we present R packages that can be used for explaining predictions from complex black box models and attributing parts of these predictions to input features. We introduce two new approaches and corresponding packages for such attribution, namely *live* and *breakDown*. We also compare their results with existing implementations of state-of-the-art solutions, namely, *lime* [@lime_pkg] which implements *Locally Interpretable Model-agnostic Explanations* and *iml* [@iml] which implements *Shapley values*.
bnclassify: Learning Bayesian Network Classifiers
The *bnclassify* package provides state-of-the art algorithms for learning Bayesian network classifiers from data. For structure learning it provides variants of the greedy hill-climbing search, a well-known adaptation of the Chow-Liu algorithm and averaged one-dependence estimators. It provides Bayesian and maximum likelihood parameter estimation, as well as three naive-Bayes-specific methods based on discriminative score optimization and Bayesian model averaging. The implementation is efficient enough to allow for time-consuming discriminative scores on medium-sized data sets. The *bnclassify* package provides utilities for model evaluation, such as cross-validated accuracy and penalized log-likelihood scores, and analysis of the underlying networks, including network plotting via the *Rgraphviz* package. It is extensively tested, with over 200 automated tests that give a code coverage of 94%. Here we present the main functionalities, illustrate them with a number of data sets, and comment on related software.
stplanr: A Package for Transport Planning
Tools for transport planning should be flexible, scalable, and transparent. The *stplanr* package demonstrates and provides a home for such tools, with an emphasis on spatial transport data and non-motorized modes. The *stplanr* package facilitates common transport planning tasks including: downloading and cleaning transport datasets; creating geographic "desire lines" from origin-destination (OD) data; route assignment, locally and interfaces to routing services such as [CycleStreets.net](CycleStreets.net){.uri}; calculation of route segment attributes such as bearing and aggregate flow; and 'travel watershed' analysis. This paper demonstrates this functionality using reproducible examples on real transport datasets. More broadly, the experience of developing and using R functions for transport applications shows that open source software can form the basis of a reproducible transport planning workflow. The *stplanr* package, alongside other packages and open source projects, could provide a more transparent and democratically accountable alternative to the current approach, which is heavily reliant on proprietary and relatively inaccessible software.
rcss: R package for optimal convex stochastic switching
The R package *rcss* provides users with a tool to approximate the value functions in the Bellman recursion under certain assumptions that guarantee desirable convergence properties. This R package represents the first software implementation of these methods using matrices and nearest neighbors. This package also employs a pathwise dynamic method to gauge the quality of these value function approximations. Statistical analysis can be performed on the results to obtain other useful practical insights. This paper describes *rcss* version 1.6.
addhaz: Contribution of Chronic Diseases to the Disability Burden Using R
The increase in life expectancy followed by the burden of chronic diseases contributes to disability at older ages. The estimation of how much chronic conditions contribute to disability can be useful to develop public health strategies to reduce the burden. This paper introduces the R package *addhaz*, which is based on the attribution method [@nusselder2004] to partition disability into the additive contributions of diseases using cross-sectional data. The R package includes tools to fit the additive hazard model, the core of the attribution method, to binary and multinomial outcomes. The models are fitted by maximizing the binomial and multinomial log-likelihood functions using constrained optimization. Wald and bootstrap confidence intervals can be obtained for the parameter estimates. Also, the contribution of diseases to the disability prevalence and their bootstrap confidence intervals can be estimated. An additional feature is the possibility to use parallel computing to obtain the bootstrap confidence intervals. In this manuscript, we illustrate the use of *addhaz* with several examples for the binomial and multinomial models, using the data from the Brazilian National Health Survey, 2013.
Snowboot: Bootstrap Methods for Network Inference
Complex networks are used to describe a broad range of disparate social systems and natural phenomena, from power grids to customer segmentation to human brain connectome. Challenges of parametric model specification and validation inspire a search for more data-driven and flexible nonparametric approaches for inference of complex networks. In this paper we discuss methodology and R implementation of two bootstrap procedures on random networks, that is, patchwork bootstrap of @Thompson:etal:2016 and @Gel:etal:2016 and vertex bootstrap of @Snijders:Borgatti:1999. To our knowledge, the new R package *snowboot* is the first implementation of the vertex and patchwork bootstrap inference on networks in R. Our new package is accompanied with a detailed user's manual, and is compatible with the popular R package on network studies *igraph*. We evaluate the patchwork bootstrap and vertex bootstrap with extensive simulation studies and illustrate their utility in an application to analysis of real world networks.
testforDEP: An R Package for Modern Distribution-free Tests and Visualization Tools for Independence
This article introduces [*testforDEP*](https://CRAN.R-project.org/package=testforDEP), a portmanteau R package implementing for the first time several modern tests and visualization tools for independence between two variables. While classical tests for independence are in the base R packages, there have been several recently developed tests for independence that are not available in R. This new package combines the classical tests including Pearson's product moment correlation coefficient method, Kendall's $\tau$ rank correlation coefficient method and Spearman's $\rho$ rank correlation coefficient method with modern tests consisting of an empirical likelihood based test, a density-based empirical likelihood ratio test, Kallenberg data-driven test, maximal information coefficient test, Hoeffding's independence test and the continuous analysis of variance test. For two input vectors of observations, the function `testforDEP` provides a common interface for each of the tests and returns test statistics, corresponding $p$ values and bootstrap confidence intervals as output. The function `AUK` provides an interface to visualize Kendall plots and computes the area under the Kendall plot similar to computing the area under a receiver operating characteristic (ROC) curve.
Navigating the R Package Universe
Today, the enormous number of contributed packages available to R users outstrips any given user's ability to understand how these packages work, their relative merits, or how they are related to each other. We organized a plenary session at useR!2017 in Brussels for the R community to think through these issues and ways forward. This session considered three key points of discussion. Users can navigate the universe of R packages with (1) capabilities for directly searching for R packages, (2) guidance for which packages to use, e.g., from CRAN Task Views and other sources, and (3) access to common interfaces for alternative approaches to essentially the same problem.\
rFSA: An R Package for Finding Best Subsets and Interactions
Herein we present the R package [*rFSA*](https://CRAN.R-project.org/package=rFSA), which implements an algorithm for improved variable selection. The algorithm searches a data space for models of a user-specified form that are statistically optimal under a measure of model quality. Many iterations afford a set of *feasible solutions* (or candidate models) that the researcher can evaluate for relevance to his or her questions of interest. The algorithm can be used to formulate new or to improve upon existing models in bioinformatics, health care, and myriad other fields in which the volume of available data has outstripped researchers' practical and computational ability to explore larger subsets or higher-order interaction terms. The package accommodates linear and generalized linear models, as well as a variety of criterion functions such as Allen's PRESS and AIC. New modeling strategies and criterion functions can be adapted easily to work with *rFSA*.
lmridge: A Comprehensive R Package for Ridge Regression
The ridge regression estimator, one of the commonly used alternatives to the conventional ordinary least squares estimator, avoids the adverse effects in the situations when there exists some considerable degree of multicollinearity among the regressors. There are many software packages available for estimation of ridge regression coefficients. However, most of them display limited methods to estimate the ridge biasing parameters without testing procedures. Our developed package, *lmridge* can be used to estimate ridge coefficients considering a range of different existing biasing parameters, to test these coefficients with more than 25 ridge related statistics, and to present different graphical displays of these statistics.
Geospatial Point Density
This paper introduces a spatial point density algorithm designed to be explainable, meaningful, and efficient. Originally designed for military applications, this technique applies to any spatial point process where there is a desire to clearly understand the measurement of density and maintain fidelity of the point locations. Typical spatial density plotting algorithms, such as kernel density estimation, implement some type of smoothing function that often results in a density value that is difficult to interpret. The purpose of the visualization method in this paper is to understand spatial point activity density with precision and meaning. The temporal tendency of the point process as an extension of the point density methodology is also discussed and displayed. Applications include visualization and measurement of any type of spatial point process. Visualization techniques integrate *ggmap* with examples from San Diego crime data.
sdpt3r: Semidefinite Quadratic Linear Programming in R
We present the package *sdpt3r*, an R implementation of the Matlab package SDPT3 [@toh1999sdpt3]. The purpose of the software is to solve semidefinite quadratic linear programming (SQLP) problems, which encompasses problems such as D-optimal experimental design, the nearest correlation matrix problem, and distance weighted discrimination, as well as problems in graph theory such as finding the maximum cut or Lovasz number of a graph.\ Current optimization packages in R include *Rdsdp*, *Rcsdp*, *scs*, *cccp*, and *Rmosek*. Of these, *scs* and *Rmosek* solve a similar suite of problems. In addition to these solvers, the R packages *CXVR* and *ROI* provide sophisticated modelling interfaces to these solvers. As a point of difference from the current solvers in R, *sdpt3r* allows for log-barrier terms in the objective function, which allows for problems such as the D-optimal design of experiments to be solved with minimal modifications . The *sdpt3r* package also provides helper functions, which formulate the required input for several well-known problems, an additional perk not present in the other R packages.
Downside Risk Evaluation with the R Package GAS
Financial risk managers routinely use non--linear time series models to predict the downside risk of the capital under management. They also need to evaluate the adequacy of their model using so--called backtesting procedures. The latter involve hypothesis testing and evaluation of loss functions. This paper shows how the R package *GAS* can be used for both the dynamic prediction and the evaluation of downside risk. Emphasis is given to the two key financial downside risk measures: Value-at-Risk (VaR) and Expected Shortfall (ES). High-level functions for: (i) prediction, (ii) backtesting, and (iii) model comparison are discussed, and code examples are provided. An illustration using the series of log--returns of the Dow Jones Industrial Average constituents is reported.
NetworkToolbox: Methods and Measures for Brain, Cognitive, and Psychometric Network Analysis in R
This article introduces the *NetworkToolbox* package for R. Network analysis offers an intuitive perspective on complex phenomena via models depicted by nodes (variables) and edges (correlations). The ability of networks to model complexity has made them the standard approach for modeling the intricate interactions in the brain. Similarly, networks have become an increasingly attractive model for studying the complexity of psychological and psychopathological phenomena. *NetworkToolbox* aims to provide researchers with state-of-the-art methods and measures for estimating and analyzing brain, cognitive, and psychometric networks. In this article, I introduce *NetworkToolbox* and provide a tutorial for applying some the package's functions to personality data.
jsr223: A Java Platform Integration for R with Programming Languages Groovy, JavaScript, JRuby, Jython, and Kotlin
The R package *jsr223* is a high-level integration for five programming languages in the Java platform: Groovy, JavaScript, JRuby, Jython, and Kotlin. Each of these languages can use Java objects in their own syntax. Hence, *jsr223* is also an integration for R and the Java platform. It enables developers to leverage Java solutions from within R by embedding code snippets or evaluating script files. This approach is generally easier than *rJava*'s low-level approach that employs the Java Native Interface. *jsr223*'s multi-language support is dependent on the Java Scripting API: an implementation of "JSR-223: Scripting for the Java Platform" that defines a framework to embed scripts in Java applications. The *jsr223* package also features extensive data exchange capabilities and a callback interface that allows embedded scripts to access the current R session. In all, *jsr223* makes solutions developed in Java or any of the *jsr223*-supported languages easier to use in R.
RcppMsgPack: MessagePack Headers and Interface Functions for R
MessagePack, or *MsgPack* for short, or when referring to the implementation, is an efficient binary serialization format for exchanging data between different programming languages. The *RcppMsgPack* package provides *R* with both the MessagePack *C++* header files, and the ability to access, create and alter MessagePack objects directly from *R*. The main driver functions of the R interface are two functions `msgpack_pack` and `msgpack_unpack`. The function `msgpack_pack` serializes *R* objects to a raw MessagePack message. The function `msgpack_unpack` de-serializes MessagePack messages back into *R* objects. Several helper functions are available to aid in processing and formatting data including `msgpack_simplify`, `msgpack_format` and `msgpack_map`.
BNSP: an R Package for Fitting Bayesian Semiparametric Regression Models and Variable Selection
The R package [*BNSP*](https://CRAN.R-project.org/package=BNSP) provides a unified framework for semiparametric location-scale regression and stochastic search variable selection. The statistical methodology that the package is built upon utilizes basis function expansions to represent semiparametric covariate effects in the mean and variance functions, and spike-slab priors to perform selection and regularization of the estimated effects. In addition to the main function that performs posterior sampling, the package includes functions for assessing convergence of the sampler, summarizing model fits, visualizing covariate effects and obtaining predictions for new responses or their means given feature/covariate vectors.
The politeness Package: Detecting Politeness in Natural Language
This package provides tools to extract politeness markers in English natural language. It also allows researchers to easily visualize and quantify politeness between groups of documents. This package combines and extends prior research on the linguistic markers of politeness [@brown:1987; @danescu:2013; @voigt:2017]. We demonstrate two applications for detecting politeness in natural language during consequential social interactions---distributive negotiations, and speed dating.
Consistency Cubes: a fast, efficient method for exact Boolean minimization.
A lot of effort has been spent over the past few decades in the QCA methodology field, to develop efficient Boolean minimization algorithms to derive an exact, and more importantly complete list of minimal prime implicants that explain the initial, observed positive configurations.\ As the complexity grows exponentially with every new condition, the required computer memory goes past the current computer resources and the polynomial time required to solve this problem quickly grows towards infinity.\ This paper introduces a new alternative to the existing non-polynomial attempts. It completely solves the memory problem, and preliminary tests show it is exponentially hundreds of time faster than eQMC, the current "best" algorithm for QCA in [R]{.sans-serif}, and probes into a territory where it competes and even outperforms engineering algorithms such as Espresso, for exact minimizations.\ While speed is not much of an issue now (eQMC is fast enough for simple data), it might prove to be essential when further developing towards all possible temporal orders, or searching for configurations in panel data over time, combined with / or automatic detection of difficult counterfactuals etc.
revengc: An R package to Reverse Engineer Summarized Data
Decoupled (e.g. separate averages) and censored (e.g. $>$ 100 species) variables are continually reported by many well-established organizations, such as the World Health Organization (WHO), Centers for Disease Control and Prevention (CDC), and World Bank. The challenge therefore is to infer what the original data could have been given summarized information. We present an R package that reverse engineers censored and/or decoupled data with two main functions. The `cnbinom.pars()` function estimates the average and dispersion parameter of a censored univariate frequency table. The `rec()` function reverse engineers summarized data into an uncensored bivariate table of probabilities.
Basis-Adaptive Selection Algorithm in dr-package
Sufficient dimension reduction (SDR) turns out to be a useful dimension reduction tool in high-dimensional regression analysis. [@dr] developed the *dr*-package to implement the four most popular SDR methods. However, the package does not provide any clear guidelines as to which method should be used given a data. Since the four methods may provide dramatically different dimension reduction results, the selection in the *dr*-package is problematic for statistical practitioners. In this paper, a basis-adaptive selection algorithm is developed in order to relieve this issue. The basic idea is to select an SDR method that provides the highest correlation between the basis estimates obtained by the four classical SDR methods. A real data example and numerical studies confirm the practical usefulness of the developed algorithm.
fICA: FastICA Algorithms and Their Improved Variants
In independent component analysis (ICA) one searches for mutually independent nongaussian latent variables when the components of the multivariate data are assumed to be linear combinations of them. Arguably, the most popular method to perform ICA is FastICA. There are two classical versions, the deflation-based FastICA where the components are found one by one, and the symmetric FastICA where the components are found simultaneously. These methods have been implemented previously in two R packages, *fastICA* and *ica*. We present the R package *fICA* and compare it to the other packages. Additional features in *fICA* include optimization of the extraction order in the deflation-based version, possibility to use any nonlinearity function, and improvement to convergence of the deflation-based algorithm. The usage of the package is demonstrated by applying it to the real ECG data of a pregnant woman.
Spatial Uncertainty Propagation Analysis with the spup R Package
Many environmental and geographical models, such as those used in land degradation, agro-ecological and climate studies, make use of spatially distributed inputs that are known imperfectly. The R package *spup* provides functions for examining the uncertainty propagation from input data and model parameters onto model outputs via the environmental model. The functions include uncertainty model specification, stochastic simulation and propagation of uncertainty using Monte Carlo (MC) techniques. Uncertain variables are described by probability distributions. Both numerical and categorical data types are handled. The package also accommodates spatial auto-correlation within a variable and cross-correlation between variables. The MC realizations may be used as input to the environmental models written in or called from R. This article provides theoretical background and three worked examples that guide users through the application of *spup*.
clustMixType: User-Friendly Clustering of Mixed-Type Data in R
Clustering algorithms are designed to identify groups in data where the traditional emphasis has been on numeric data. In consequence, many existing algorithms are devoted to this kind of data even though a combination of numeric and categorical data is more common in most business applications. Recently, new algorithms for clustering mixed-type data have been proposed based on Huang's k-prototypes algorithm. This paper describes the R package *clustMixType* which provides an implementation of k-prototypes in R.
Stilt: Easy Emulation of Time Series AR(1) Computer Model Output in Multidimensional Parameter Space
Statistically approximating or "emulating" time series model output in parameter space is a common problem in climate science and other fields. There are many packages for spatio-temporal modeling. However, they often lack focus on time series, and exhibit statistical complexity. Here, we present the R package *stilt* designed for simplified AR(1) time series Gaussian process emulation, and provide examples relevant to climate modelling. Notably absent is Markov chain Monte Carlo estimation -- a challenging concept to many scientists. We keep the number of user choices to a minimum. Hence, the package can be useful pedagogically, while still applicable to real life emulation problems. We provide functions for emulator cross-validation, empirical coverage, prediction, as well as response surface plotting. While the examples focus on climate model emulation, the emulator is general and can be also used for kriging spatio-temporal data.
SMM: An `R` Package for Estimation and Simulation of Discrete-time semi-Markov Models
Semi-Markov models, independently introduced by @Lev54, @Smi55 and @Tak54, are a generalization of the well-known Markov models. For semi-Markov models, sojourn times can be arbitrarily distributed, while sojourn times of Markov models are constrained to be exponentially distributed (in continuous time) or geometrically distributed (in discrete time). The aim of this paper is to present the R package *SMM*, devoted to the simulation and estimation of discrete-time multi-state semi-Markov and Markov models. For the semi-Markov case we have considered: parametric and non-parametric estimation; with and without censoring at the beginning and/or at the end of sample paths; one or several independent sample paths. Several discrete-time distributions are considered for the parametric estimation of sojourn time distributions of semi-Markov chains: Uniform, Geometric, Poisson, Discrete Weibull and Binomial Negative.
ggplot2 Compatible Quantile-Quantile Plots in R
Q-Q plots allow us to assess univariate distributional assumptions by comparing a set of quantiles from the empirical and the theoretical distributions in the form of a scatterplot. To aid in the interpretation of Q-Q plots, reference lines and confidence bands are often added. We can also detrend the Q-Q plot so the vertical comparisons of interest come into focus. Various implementations of Q-Q plots exist in R, but none implements all of these features. *qqplotr* extends *ggplot2* to provide a complete implementation of Q-Q plots. This paper introduces the plotting framework provided by *qqplotr* and provides multiple examples of how it can be used.
Forecast Combinations in R using the ForecastComb Package
This paper introduces the R package *ForecastComb*. The aim is to provide researchers and practitioners with a comprehensive implementation of the most common ways in which forecasts can be combined. The package in its current version covers 15 popular estimation methods for creating a combined forecasts -- including simple methods, regression-based methods, and eigenvector-based methods. It also includes useful tools to deal with common challenges of forecast combination (e.g., missing values in component forecasts, or multicollinearity), and to rationalize and visualize the combination results.
Profile Likelihood Estimation of the Correlation Coefficient in the Presence of Left, Right or Interval Censoring and Missing Data
We discuss implementation of a profile likelihood method for estimating a Pearson correlation coefficient from bivariate data with censoring and/or missing values. The method is implemented in an [R]{.sans-serif} package *clikcorr* which calculates maximum likelihood estimates of the correlation coefficient when the data are modeled with either a Gaussian or a Student $t$-distribution, in the presence of left, right, or interval censored and/or missing data. The [R]{.sans-serif} package includes functions for conducting inference and also provides graphical functions for visualizing the censored data scatter plot and profile log likelihood function. The performance of *clikcorr* in a variety of circumstances is evaluated through extensive simulation studies. We illustrate the package using two dioxin exposure datasets.
The utiml Package: Multi-label Classification in R
Learning classification tasks in which each instance is associated with one or more labels are known as multi-label learning. The implementation of multi-label algorithms, performed by different researchers, have several specificities, like input/output format, different internal functions, distinct programming language, to mention just some of them. As a result, current machine learning tools include only a small subset of multi-label decomposition strategies. The *utiml* package is a framework for the application of classification algorithms to multi-label data. Like the well known MULAN used with Weka, it provides a set of multi-label procedures such as sampling methods, transformation strategies, threshold functions, pre-processing techniques and evaluation metrics. The package was designed to allow users to easily perform complete multi-label classification experiments in the R environment. This paper describes the *utiml* API and illustrates its use in different multi-label classification scenarios.
Dot-Pipe: an S3 Extensible Pipe for R
Pipe notation is popular with a large league of R users, with *magrittr* being the dominant realization. However, this should not be enough to consider piping in R as a settled topic that is not subject to further discussion, experimentation, or possibility for improvement. To promote innovation opportunities, we describe the *wrapr* R package and "dot-pipe" notation, a well behaved sequencing operator with S3 extensibility. We include a number of examples of using this pipe to interact with and extend other R packages.
nsROC: An R package for Non-Standard ROC Curve Analysis
The receiver operating characteristic (ROC) curve is a graphical method which has become standard in the analysis of diagnostic markers, that is, in the study of the classification ability of a numerical variable. Most of the commercial statistical software provide routines for the standard ROC curve analysis. Of course, there are also many R packages dealing with the ROC estimation as well as other related problems. In this work we introduce the *nsROC* package which incorporates some new ROC curve procedures. Particularly: ROC curve comparison based on general distances among functions for both paired and unpaired designs; efficient confidence bands construction; a generalization of the curve considering different classification subsets than the one involved in the classical definition of the ROC curve; a procedure to deal with censored data in cumulative-dynamic ROC curve estimation for time-to-event outcomes; and a non-parametric ROC curve method for meta-analysis. This is the only R package which implements these particular procedures.
mmpf: Monte-Carlo Methods for Prediction Functions
Machine learning methods can often learn high-dimensional functions which generalize well but are not human interpretable. The ***mmpf*** package marginalizes prediction functions using Monte-Carlo methods, allowing users to investigate the behavior of these learned functions, as on a lower dimensional subset of input features: partial dependence and variations thereof. This makes machine learning methods more useful in situations where accurate prediction is not the only goal, such as in the social sciences where linear models are commonly used because of their interpretability.
dimRed and coRanking---Unifying Dimensionality Reduction in R
"Dimensionality reduction" (DR) is a widely used approach to find low dimensional and interpretable representations of data that are natively embedded in high-dimensional spaces. DR can be realized by a plethora of methods with different properties, objectives, and, hence, (dis)advantages. The resulting low-dimensional data embeddings are often difficult to compare with objective criteria. Here, we introduce the [***dimRed***](https://CRAN.R-project.org/package=dimRed) and [***coRanking***](https://CRAN.R-project.org/package=coRanking) packages for the R language. These open source software packages enable users to easily access multiple classical and advanced DR methods using a common interface. The packages also provide quality indicators for the embeddings and easy visualization of high dimensional data. The ***coRanking*** package provides the functionality for assessing DR methods in the co-ranking matrix framework. In tandem, these packages allow for uncovering complex structures high dimensional data. Currently 15 DR methods are available in the package, some of which were not previously available to R users. Here, we outline the ***dimRed*** and ***coRanking*** packages and make the implemented methods understandable to the interested reader.
Collections in R: Review and Proposal
R is a powerful tool for data processing, visualization, and modeling. However, R is slower than other languages used for similar purposes, such as Python. One reason for this is that R lacks base support for collections, abstract data types that store, manipulate, and return data (e.g., sets, maps, stacks). An exciting recent trend in the R extension ecosystem is the development of collection packages, packages that provide classes that implement common collections. At least 12 collection packages are available across the two major R extension repositories, the Comprehensive R Archive Network (CRAN) and Bioconductor. In this article, we compare collection packages in terms of their features, design philosophy, ease of use, and performance on benchmark tests. We demonstrate that, when used well, the data structures provided by collection packages are in many cases significantly faster than the data structures provided by base R. We also highlight current deficiencies among R collection packages and propose avenues of possible improvement. This article provides useful recommendations to R programmers seeking to speed up their programs and aims to inform the development of future collection-oriented software for R.
Small Area Disease Risk Estimation and Visualization Using R
Small area disease risk estimation is essential for disease prevention and control. In this paper, we demonstrate how R can be used to obtain disease risk estimates and quantify risk factors using areal data. We explain how to define disease risk models and how to perform Bayesian inference using the ***INLA*** package. We also show how to make interactive maps of estimates using the ***leaflet*** package to better understand the disease spatial patterns and communicate the results. We show an example of lung cancer risk in Pennsylvania, United States, in year 2002, and demonstrate that R represents an excellent tool for disease surveillance by enabling reproducible health data analysis.
RatingScaleReduction package: stepwise rating scale item reduction without predictability loss
This study presents an innovative method for reducing the number of rating scale items without predictability loss. The "area under the receiver operator curve" method (AUC ROC) is used for the stepwise method of reducing items of a rating scale. ***RatingScaleReduction*** R package contains the presented implementation. Differential evolution (a metaheuristic for optimization) was applied to one of the analyzed datasets to illustrate that the presented stepwise method can be used with other classifiers to reduce the number of rating scale items (variables). The targeted areas of application are decision making, data mining, machine learning, and psychometrics.\ **Keywords:** rating scale, receiver operator characteristic, ROC, AUC, scale reduction.
ICSOutlier: Unsupervised Outlier Detection for Low-Dimensional Contamination Structure
Detecting outliers in a multivariate and unsupervised context is an important and ongoing problem notably for quality control. Many statistical methods are already implemented in R and are briefly surveyed in the present paper. But only a few lead to the accurate identification of potential outliers in the case of a small level of contamination. In this particular context, the Invariant Coordinate Selection (ICS) method shows remarkable properties for identifying outliers that lie on a low-dimensional subspace in its first invariant components. It is implemented in the ***ICSOutlier*** package. The main function of the package, `ics.outlier`, offers the possibility of labelling potential outliers in a completely automated way. Four examples, including two real examples in quality control, illustrate the use of the function. Comparing with several other approaches, it appears that ICS is generally as efficient as its competitors and shows an advantage in the context of a small proportion of outliers lying in a low-dimensional subspace. In quality control, the method may help in properly identifying some defective products while not detecting too many false positives.
RealVAMS: An R Package for Fitting a Multivariate Value-added Model (VAM)
We present [***RealVAMS***](https://CRAN.R-project.org/package=RealVAMS), an R package for fitting a generalized linear mixed model to multimembership data with partially crossed and partially nested random effects. ***RealVAMS*** utilizes a multivariate generalized linear mixed model with pseudo-likelihood approximation for fitting normally distributed continuous response(s) jointly with a binary outcome. In an educational context, the model is referred to as a multidimensional value-added model, which extends previous theory to estimate the relationships between potential teacher contributions toward different student outcomes and to allow the consideration of a binary, real-world outcome such as graduation. The simultaneous joint modeling of continuous and binary outcomes was not available prior to ***RealVAMS*** due to computational difficulties. In this paper, we discuss the multidimensional model, describe ***RealVAMS***, and demonstrate the use of this package and its modeling options with an educational data set.
PanJen: An R package for Ranking Transformations in a Linear Regression
***PanJen*** is an R-package for ranking transformations in linear regressions. It provides users with the ability to explore the relationship between a dependent variable and its independent variables. The package offers an easy and data-driven way to choose a functional form in multiple linear regression models by comparing a range of parametric transformations. The parametric functional forms are benchmarked against each other and a non-parametric transformation. The package allows users to generate plots that show the relation between a covariate and the dependent variable. Furthermore, ***PanJen*** will enable users to specify specific functional transformations, driven by a priori and theory-based hypotheses. The package supplies both model fits and plots that allow users to make informed choices on the functional forms in their regression. We show that the ranking in PanJen outperforms the Box-Tidwell transformation, especially in the presence of inefficiency, heteroscedasticity or endogeneity.
Tackling Uncertainties of Species Distribution Model Projections with Package mopa
Species Distribution Models (SDMs) constitute an important tool to assist decision-making in environmental conservation and planning in the context of climate change. Nevertheless, SDM projections are affected by a wide range of uncertainty factors (related to training data, climate projections and SDM techniques), which limit their potential value and credibility. The new package ***mopa*** provides tools for designing comprehensive multi-factor SDM ensemble experiments, combining multiple sources of uncertainty (e.g. baseline climate, pseudo-absence realizations, SDM techniques, future projections) and allowing to assess their contribution to the overall spread of the ensemble projection. In addition, ***mopa*** is seamlessly integrated with the [climate4R](http://www.meteo.unican.es/climate4R) bundle and allows straightforward retrieval and post-processing of state-of-the-art climate datasets (including observations and climate change projections), thus facilitating the proper analysis of key uncertainty factors related to climate data.
FHDI: An R Package for Fractional Hot Deck Imputation
Fractional hot deck imputation (FHDI), proposed by [@kalton84] and investigated by [@kim04], is a tool for handling item nonresponse in survey sampling. In FHDI, each missing item is filled with multiple observed values yielding a single completed data set for subsequent analyses. An R package ***FHDI*** is developed to perform FHDI and also the fully efficient fractional imputation (FEFI) method of [@fuller05] to impute multivariate missing data with arbitrary missing patterns. FHDI substitutes missing items with a few observed values jointly obtained from a set of donors whereas the FEFI uses all the possible donors. This paper introduces ***FHDI*** as a tool for implementing the multivariate version of fractional hot deck imputation discussed in [@im15] as well as FEFI. For variance estimation of FHDI and FEFI, the Jackknife method is implemented, and replicated weights are provided as a part of the output.
Bayesian Testing, Variable Selection and Model Averaging in Linear Models using R with BayesVarSel
In this paper, objective Bayesian methods for hypothesis testing and variable selection in linear models are considered. The focus is on ***BayesVarSel***, an R package that computes posterior probabilities of hypotheses/models and provides a suite of tools to properly summarize the results. We introduce the usage of specific functions to compute several types of model averaging estimations and predictions weighted by posterior probabilities. ***BayesVarSel*** contains exact algorithms to perform fast computations in problems of small to moderate size and heuristic sampling methods to solve large problems. We illustrate the functionalities of the package with several data examples.
onewaytests: An R Package for One-Way Tests in Independent Groups Designs
One-way tests in independent groups designs are the most commonly utilized statistical methods with applications on the experiments in medical sciences, pharmaceutical research, agriculture, biology, engineering, social sciences and so on. In this paper, we present the [***onewaytests***](https://CRAN.R-project.org/package=onewaytests) package to investigate treatment effects on the dependent variable. The package offers the one-way tests in independent groups designs, which include ANOVA, Welch's heteroscedastic *F* test, Welch's heteroscedastic *F* test with trimmed means and Winsorized variances, Brown-Forsythe test, Alexander-Govern test, James second order test and Kruskal-Wallis test. The package also provides pairwise comparisons, graphical approaches, and assesses variance homogeneity and normality of data in each group via tests and plots. A simulation study is also conducted to give recommendations for applied researchers on the selection of appropriate one-way tests under assumption violations. Furthermore, especially for non-R users, a user-friendly web application of the package is provided. This application is available at <http://www.softmed.hacettepe.edu.tr/onewaytests>.
Inventorymodel: an R Package for Centralized Inventory Problems
Inventory management of goods is an integral part of logistics systems; common to various economic sectors such as industry, agriculture and trade; and independent of production volume. In general, as companies seek to minimize economic losses, studies on problems of multi-agent inventory have increased in recent years. A multi-agent inventory problem is a situation in which several agents face individual inventory problems and agree to coordinate their orders with the objective of reducing their costs. The R package ***Inventorymodel*** allows the determination of both the optimal policy for some inventory situations with deterministic demands and the allocation of costs from a game-theoretic perspective. The required calculations may be computed for any number of agents although the computational complexity of this class of problems when the involved agents enlarge is not reduced. In this work, the different possibilities that the package offers are described and some examples of usage are also demonstrated.
R Package imputeTestbench to Compare Imputation Methods for Univariate Time Series
Missing observations are common in time series data and several methods are available to impute these values prior to analysis. Variation in statistical characteristics of univariate time series can have a profound effect on characteristics of missing observations and, therefore, the accuracy of different imputation methods. The ***imputeTestbench*** package can be used to compare the prediction accuracy of different methods as related to the amount and type of missing data for a user-supplied dataset. Missing data are simulated by removing observations completely at random or in blocks of different sizes depending on characteristics of the data. Several imputation algorithms are included with the package that vary from simple replacement with means to more complex interpolation methods. The testbench is not limited to the default functions and users can add or remove methods as needed. Plotting functions also allow comparative visualization of the behavior and effectiveness of different algorithms. We present example applications that demonstrate how the package can be used to understand differences in prediction accuracy between methods as affected by characteristics of a dataset and the nature of missing data.
rpostgis: Linking R with a PostGIS Spatial Database
With the proliferation of sensors and the ease of data collection from online sources, large datasets have become the norm in many scientific disciplines, and efficient data storage, management, and retrival is imperative for large research projects. Relational databases provide a solution, but in order to be useful, must be able to be linked to analysis and visualization tools, such as R. Here, we present a package intended to facilitate integration of R with the open-source database software PostgreSQL, with a focus on its spatial extension, PostGIS. The package ***rpostgis*** (version 1.4.1) provides methods for spatial data handling (vector and raster) between PostGIS-enabled databases and R, methods for R `"data.frame"`s storage in PostgreSQL, and a set of convenient wrappers for common database procedures. We thus expect ***rpostgis*** to be useful for both (1) existing users of spatial data in R and/or PostGIS, and (2) R users who have yet to adopt relational databases for their projects.
lba: An R Package for Latent Budget Analysis
The latent budget model is a mixture model for compositional data sets in which the entries, a contingency table, may be either realizations from a product multinomial distribution or distribution free. Based on this model, the latent budget analysis considers the interactions of two variables; the explanatory (row) and the response (column) variables. The package ***lba*** uses expectation-maximization and active constraints method (ACM) to carry out, respectively, the maximum likelihood and the least squares estimation of the model parameters. It contains three main functions, `lba` which performs the analysis, `goodnessfit` for model selection and goodness of fit and the plotting functions `plotcorr` and `plotlba` used as a help in the interpretation of the results.
Semiparametric Generalized Linear Models with the gldrm Package
This paper introduces a new algorithm to estimate and perform inferences on a recently proposed and developed semiparametric generalized linear model (glm). Rather than selecting a particular parametric exponential family model, such as the Poisson distribution, this semiparametric glm assumes that the response is drawn from the more general exponential tilt family. The regression coefficients and unspecified reference distribution are estimated by maximizing a semiparametric likelihood. The new algorithm incorporates several computational stability and efficiency improvements over the algorithm originally proposed. In particular, the new algorithm performs well for either small or large support for the nonparametric response distribution. The algorithm is implemented in a new R package called *gldrm*.
LP Algorithms for Portfolio Optimization: The PortfolioOptim Package
The paper describes two algorithms for financial portfolio optimization with the following risk measures: CVaR, MAD, LSAD and dispersion CVaR. These algorithms can be applied to discrete distributions of asset returns since then the optimization problems can be reduced to linear programs. The first algorithm solves a simple recourse problem as described by Haneveld using Benders decomposition method. The second algorithm finds an optimal portfolio with the smallest distance to a given benchmark portfolio and is an adaptation of the least norm solution (called also normal solution) of linear programs due to Zhao and Li. The algorithms are implemented in R in the package ***PortfolioOptim***.
Welfare, Inequality and Poverty Analysis with rtip: An Approach Based on Stochastic Dominance
Disparities in economic welfare, inequality and poverty across and within countries are of great interest to sociologists, economists, researchers, social organizations and political scientists. Information about these topics is commonly based on surveys. We present a package called ***rtip*** that implements techniques based on stochastic dominance to make unambiguous comparisons, in terms of welfare, poverty and inequality, among income distributions. Besides providing point estimates and confidence intervals for the most commonly used indicators of these characteristics, the package ***rtip*** estimates the usual Lorenz curve, the generalized Lorenz curve, the TIP (Three I's of Poverty) curve and allows to test statistically whether one curve is dominated by another.
SetMethods: an Add-on R Package for Advanced QCA
This article presents the functionalities of the R package ***SetMethods***, aimed at performing advanced set-theoretic analyses. This includes functions for performing set-theoretic multi-method research, set-theoretic theory evaluation, Enhanced Standard Analysis, diagnosing the impact of temporal, spatial, or substantive clusterings of the data on the results obtained via Qualitative Comparative Analysis (QCA), indirect calibration, and visualising QCA results via XY plots or radar charts. Each functionality is presented in turn, the conceptual idea and the logic behind the procedure being first summarized, and afterwards illustrated with data from [@SchneiderM2010].
HRM: An R Package for Analysing High-dimensional Multi-factor Repeated Measures
High-dimensional longitudinal data pose a serious challenge for statistical inference as many test statistics cannot be computed for high-dimensional data, or they do not maintain the nominal type-I error rate, or have very low power. Therefore, it is necessary to derive new inference methods capable of dealing with high dimensionality, and to make them available to statistics practitioners. One such method is implemented in the package ***HRM*** described in this article. This new method uses a similar approach as the Welch-Satterthwaite $t$-test approximation and works very well for high-dimensional data as long as the data distribution is not too skewed or heavy-tailed. The package also provides a GUI to offer an easy way to apply the methods.
Advanced Bayesian Multilevel Modeling with the R Package brms
The ***brms*** package allows R users to easily specify a wide range of Bayesian single-level and multilevel models which are fit with the probabilistic programming language Stan behind the scenes. Several response distributions are supported, of which all parameters (e.g., location, scale, and shape) can be predicted. Non-linear relationships may be specified using non-linear predictor terms or semi-parametric approaches such as splines or Gaussian processes. Multivariate models can be fit as well. To make all of these modeling options possible in a multilevel framework, ***brms*** provides an intuitive and powerful formula syntax, which extends the well known formula syntax of ***lme4***. The purpose of the present paper is to introduce this syntax in detail and to demonstrate its usefulness with four examples, each showing relevant aspects of the syntax.
Support Vector Machines for Survival Analysis with R
This article introduces the R package [***survivalsvm***](https://CRAN.R-project.org/package=survivalsvm), implementing support vector machines for survival analysis. Three approaches are available in the package: The regression approach takes censoring into account when formulating the inequality constraints of the support vector problem. In the ranking approach, the inequality constraints set the objective to maximize the concordance index for comparable pairs of observations. The hybrid approach combines the regression and ranking constraints in a single model. We describe survival support vector machines and their implementation, provide examples and compare the prediction performance with the Cox proportional hazards model, random survival forests and gradient boosting using several real datasets. On these datasets, survival support vector machines perform on par with the reference methods.
Nonparametric Independence Tests and $k$-sample Tests for Large Sample Sizes Using Package HHG
Nonparametric tests of independence and $k$-sample tests are ubiquitous in modern applications, but they are typically computationally expensive. We present a family of nonparametric tests that are computationally efficient and powerful for detecting any type of dependence between a pair of univariate random variables. The computational complexity of the suggested tests is sub-quadratic in sample size, allowing calculation of test statistics for millions of observations. We survey both algorithms and the ***HHG*** package in which they are implemented, with usage examples showing the implementation of the proposed tests for both the independence case and the $k$-sample problem. The tests are compared to existing nonparametric tests via several simulation studies comparing both runtime and power. Special focus is given to the design of data structures used in implementation of the tests. These data structures can be useful for developers of nonparametric distribution-free tests.
Simple Features for R: Standardized Support for Spatial Vector Data
Simple features are a standardized way of encoding spatial vector data (points, lines, polygons) in computers. The ***sf*** package implements simple features in R, and has roughly the same capacity for spatial vector data as packages ***sp***, ***rgeos***, and ***rgdal***. We describe the need for this package, its place in the R package ecosystem, and its potential to connect R to other computer systems. We illustrate this with examples of its use.
Pstat: An R Package to Assess Population Differentiation in Phenotypic Traits
The package [***Pstat***](https://CRAN.R-project.org/package=Pstat) calculates $P_{ST}$ values to assess differentiation among populations from a set of quantitative traits and provides bootstrapped distributions and confidence intervals for $P_{ST}$. Variations of $P_{ST}$ as a function of the parameter $c/h^2$ are studied as well. The package implements different transformations of the measured phenotypic traits to eliminate variation resulting from allometric growth, including calculation of residuals from linear regression, Reist standardization, and the Aitchison transformation.
Approximating the Sum of Independent Non-Identical Binomial Random Variables
The distribution of the sum of independent non-identical binomial random variables is frequently encountered in areas such as genomics, healthcare, and operations research. Analytical solutions for the density and distribution are usually cumbersome to find and difficult to compute. Several methods have been developed to approximate the distribution, among which is the saddlepoint approximation. However, implementation of the saddlepoint approximation is non-trivial. In this paper, we implement the saddlepoint approximation in the ***sinib*** package and provide two examples to illustrate its usage. One example uses simulated data while the other uses real-world healthcare data. The ***sinib*** package addresses the gap between the theory and the implementation of approximating the sum of independent non-identical binomials.
cchs: An R Package for Stratified Case-Cohort Studies
The [*cchs*](https://CRAN.R-project.org/package=cchs) package contains a function, also called `cchs`, for analyzing data from a stratified case-cohort study, as used in epidemiology. For data from this type of study, `cchs` calculates Estimator III of @borgan2000, which is a score-unbiased estimator for the regression coefficients in the Cox proportional hazards model. From the user's point of view, the function is similar to `coxph` (in the [*survival*](https://CRAN.R-project.org/package=survival) package) and other widely used model-fitting functions. Convenient software has not previously been available for Estimator III since it is complicated to calculate. SAS and S-Plus code-fragments for the calculation have been published, but `cchs` is easier to use and more efficient in terms of time and memory, and can cope with much larger datasets. It also avoids several minor approximations and simplifications.
InfoTrad: An R package for estimating the probability of informed trading
The purpose of this paper is to introduce the R package ***InfoTrad*** for estimating the probability of informed trading (PIN) initially proposed by @1996Easleyetal. PIN is a popular information asymmetry measure that proxies the proportion of informed traders in the market. This study provides a short survey on alternative estimation techniques for the PIN. There are many problems documented in the existing literature in estimating PIN. ***InfoTrad*** package aims to address two problems. First, the sequential trading structure proposed by @1996Easleyetal and later extended by @2002Easleyetal is prone to sample selection bias for stocks with large trading volumes, due to floating point exception. This problem is solved by different factorizations provided by @2010Easleyetal (EHO factorization) and @2011LinandKe (LK factorization). Second, the estimates are prone to bias due to boundary solutions. A grid-search algorithm (YZ algorithm) is proposed by @2012YanandZhang to overcome the bias introduced due to boundary estimates. In recent years, clustering algorithms have become popular due to their flexibility in quickly handling large data sets. @2015Ganetal propose an algorithm (GAN algorithm) to estimate PIN using hierarchical agglomerative clustering which is later extended by @2016ErsanandAlici (EA algorithm). The package ***InfoTrad*** offers LK and EHO factorizations given an input matrix and initial parameter vector. In addition, these factorizations can be used to estimate PIN through YZ algorithm, GAN algorithm and EA algorithm.
Generalized Additive Model Multiple Imputation by Chained Equations With Package ImputeRobust
Data analysis, common to all empirical sciences, often requires complete data sets. Unfortunately, real world data collection will usually result in data values not being observed. We present a package for robust multiple imputation (the ***ImputeRobust*** package) that allows the use of generalized additive models for location, scale, and shape in the context of chained equations. The paper describes the basics of the imputation technique which builds on a semi-parametric regression model (GAMLSS) and the algorithms and functions provided with the corresponding package. Furthermore, some illustrative examples are provided.
MGLM: An R Package for Multivariate Categorical Data Analysis
Data with multiple responses is ubiquitous in modern applications. However, few tools are available for regression analysis of multivariate counts. The most popular multinomial-logit model has a very restrictive mean-variance structure, limiting its applicability to many data sets. This article introduces an R package ***MGLM***, short for multivariate response generalized linear models, that expands the current tools for regression analysis of polytomous data. Distribution fitting, random number generation, regression, and sparse regression are treated in a unifying framework. The algorithm, usage, and implementation details are discussed.
ArCo: An R package to Estimate Artificial Counterfactuals
In this paper we introduce the ***ArCo*** package for R which consists of a set of functions to implement the the Artificial Counterfactual (ArCo) methodology to estimate causal effects of an intervention (treatment) on aggregated data and when a control group is not necessarily available. The ArCo method is a two-step procedure, where in the first stage a counterfactual is estimated from a large panel of time series from a pool of untreated peers. In the second-stage, the average treatment effect over the post-intervention sample is computed. Standard inferential procedures are available. The package is illustrated with both simulated and real datasets.
A System for an Accountable Data Analysis Process in R
Efficiently producing transparent analyses may be difficult for beginners or tedious for the experienced. This implies a need for computing systems and environments that can efficiently satisfy reproducibility and accountability standards. To this end, we have developed a system, R package, and R Shiny application called *adapr* (Accountable Data Analysis Process in R) that is built on the principle of accountable units. An accountable unit is a data file (statistic, table or graphic) that can be associated with a provenance, meaning how it was created, when it was created and who created it, and this is similar to the 'verifiable computational results' (VCR) concept proposed by Gavish and Donoho. Both accountable units and VCRs are version controlled, sharable, and can be incorporated into a collaborative project. However, accountable units use file hashes and do not involve watermarking or public repositories like VCRs. Reproducing collaborative work may be highly complex, requiring repeating computations on multiple systems from multiple authors; however, determining the provenance of each unit is simpler, requiring only a search using file hashes and version control systems.
GrpString: An R Package for Analysis of Groups of Strings
The R package ***GrpString*** was developed as a comprehensive toolkit for quantitatively analyzing and comparing groups of strings. It offers functions for researchers and data analysts to prepare strings from event sequences, extract common patterns from strings, and compare patterns between string vectors. The package also finds transition matrices and complexity of strings, determines clusters in a string vector, and examines the statistical difference between two groups of strings.
Epistemic Game Theory: Putting Algorithms to Work
The aim of this study is to construct an epistemic model in which each rational choice under common belief in rationality is supplemented by a type which expresses such a belief. In practice, the finding of type depends on manual solution approach with some mathematical operations in scope of the theory. This approach becomes less convenient with the growth of the size of the game. To solve this difficulty, a linear programming model is constructed for two-player, static and non-cooperative games to find the type that is supporting that player's rational choice is optimal under common belief in rationality and maximizing the utility of the game. Since the optimal choice would only be made from rational choices, it is first necessary to eliminate all strictly dominated choices. In real life, the games are usually large sized. Therefore, the elimination process should be performed in a computer environment. Since software related to game theory was mostly prepared with a result-oriented approach for some types of games, it was necessary to develop software to execute the iterated elimination method. With this regard, a program has been developed that determines the choices that are strictly dominated by pure and randomized choices in two-player games. Two functions named "esdc" and "type" are created by using R statistical programming language for the operations performed in both parts, and these functions are added to the content of an R package after its creation with the name ***EpistemicGameTheory***.
Residuals and Diagnostics for Binary and Ordinal Regression Models: An Introduction to the sure Package
Residual diagnostics is an important topic in the classroom, but it is less often used in practice when the response is binary or ordinal. Part of the reason for this is that generalized models for discrete data, like cumulative link models and logistic regression, do not produce standard residuals that are easily interpreted as those in ordinary linear regression. In this paper, we introduce the R package ***sure***, which implements a recently developed idea of **SU**rrogate **RE**siduals. We demonstrate the utility of the package in detection of cumulative link model misspecification with respect to mean structures, link functions, heteroscedasticity, proportionality, and interaction effects.
RQGIS: Integrating R with QGIS for Statistical Geocomputing
Integrating R with Geographic Information Systems (GIS) extends R's statistical capabilities with numerous geoprocessing and data handling tools available in a GIS. QGIS is one of the most popular open-source GIS, and it furthermore integrates other GIS programs such as the System for Automated Geoscientific Analyses (SAGA) GIS and the Geographic Resources Analysis Support System (GRASS) GIS within a single software environment. This and its QGIS Python API makes it a perfect candidate for console-based geoprocessing. By establishing an interface, the R package *RQGIS* makes it possible to use QGIS as a geoprocessing workhorse from within R. Compared to other packages building a bridge to GIS (e.g., *rgrass7*, *RSAGA*, *RPyGeo*), *RQGIS* offers a wider range of geoalgorithms, and is often easier to use due to various convenience functions. Finally, *RQGIS* supports the seamless integration of Python code using *reticulate* from within R for improved extendability.
rpsftm: An R Package for Rank Preserving Structural Failure Time Models
Treatment switching in a randomised controlled trial occurs when participants change from their randomised treatment to the other trial treatment during the study. Failure to account for treatment switching in the analysis (i.e. by performing a standard intention-to-treat analysis) can lead to biased estimates of treatment efficacy. The rank preserving structural failure time model (RPSFTM) is a method used to adjust for treatment switching in trials with survival outcomes. The RPSFTM is due to [@robins:91] and has been developed by [@white:97; @white:99].\ The method is randomisation based and uses only the randomised treatment group, observed event times, and treatment history in order to estimate a causal treatment effect. The treatment effect, $\psi$, is estimated by balancing counter-factual event times (that would be observed if no treatment were received) between treatment groups. G-estimation is used to find the value of $\psi$ such that a test statistic $Z\left(\psi\right) = 0$. This is usually the test statistic used in the intention-to-treat analysis, for example, the log rank test statistic.\ We present an R package, *rpsftm*, that implements the method.
glmmTMB Balances Speed and Flexibility Among Packages for Zero-inflated Generalized Linear Mixed Modeling
Count data can be analyzed using generalized linear mixed models when observations are correlated in ways that require random effects. However, count data are often *zero-inflated*, containing more zeros than would be expected from the typical error distributions. We present a new package, *glmmTMB*, and compare it to other R packages that fit zero-inflated mixed models. The *glmmTMB* package fits many types of GLMMs and extensions, including models with continuously distributed responses, but here we focus on count responses. *glmmTMB* is faster than *glmmADMB*, *MCMCglmm*, and *brms*, and more flexible than *INLA* and *mgcv* for zero-inflated modeling. One unique feature of *glmmTMB* (among packages that fit zero-inflated mixed models) is its ability to estimate the Conway-Maxwell-Poisson distribution parameterized by the mean. Overall, its most appealing features for new users may be the combination of speed, flexibility, and its interface's similarity to *lme4*.
carx:an R Package to Estimate Censored Autoregressive Time Series with Exogenous Covariates
We implement in the R package ***carx*** a novel and computationally efficient quasi-likelihood method for estimating a censored autoregressive model with exogenous covariates. The proposed quasi-likelihood method reduces to maximum likelihood estimation in absence of censoring. The ***carx*** package contains many useful functions for practical data analysis with censored stochastic regression, including functions for outlier detection, model diagnostics, and prediction with censored time series data. We illustrate the capabilities of the ***carx*** package with simulations and an elaborate real data analysis.
An Introduction to Rocker: Docker Containers for R
We describe the Rocker project, which provides a widely-used suite of Docker images with customized R environments for particular tasks. We discuss how this suite is organized, and how these tools can increase portability, scaling, reproducibility, and convenience of R users and developers.
Simulating Probabilistic Long-Term Effects in Models with Temporal Dependence
The R package *pltesim* calculates and depicts probabilistic long-term effects in binary models with temporal dependence variables. The package performs two tasks. First, it calculates the change in the probability of the event occurring given a change in a theoretical variable. Second, it calculates the rolling difference in the future probability of the event for two scenarios: one where the event occurred at a given time and one where the event does not occur. The package is consistent with the recent movement to depict meaningful and easy-to-interpret quantities of interest with the requisite measures of uncertainty. It is the first to make it easy for researchers to interpret short- and long-term effects of explanatory variables in binary autoregressive models, which can have important implications for the correct interpretation of these models.
ManlyMix: An R Package for Manly Mixture Modeling
Model-based clustering is a popular technique for grouping objects based on a finite mixture model. It has countless applications in different fields of study. The R package *ManlyMix* implements the Manly mixture model that allows modeling skewness within data groups and performs cluster analysis. *ManlyMix* is a powerful diagnostics tool that is capable of conducting investigation concerning the normality of variables upon fitting of a Manly forward or backward model. Theoretical foundations as well as description of functions are provided. All features of the package are illustrated with examples in great detail. The analysis of real-life datasets demonstrates the flexibility and usefulness of the package.
Partial Rank Data with the hyper2 Package: Likelihood Functions for Generalized Bradley-Terry Models
Here I present the *hyper2* package for generalized Bradley-Terry models and give examples from two competitive situations: single scull rowing, and the competitive cooking game show MasterChef Australia. A number of natural statistical hypotheses may be tested straightforwardly using the software.
riskRegression: Predicting the Risk of an Event using Cox Regression Models
In the presence of competing risks a prediction of the time-dynamic absolute risk of an event can be based on cause-specific Cox regression models for the event and the competing risks [@benichou1990estimates]. We present computationally fast and memory optimized C++ functions with an R interface for predicting the covariate specific absolute risks, their confidence intervals, and their confidence bands based on right censored time to event data. We provide explicit formulas for our implementation of the estimator of the (stratified) baseline hazard function in the presence of tied event times. As a by-product we obtain fast access to the baseline hazards (compared to `survival::basehaz()`) and predictions of survival probabilities, their confidence intervals and confidence bands. Confidence intervals and confidence bands are based on point-wise asymptotic expansions of the corresponding statistical functionals. The software presented here is implemented in the ***riskRegression*** package.
openEBGM: An R Implementation of the Gamma-Poisson Shrinker Data Mining Model
We introduce the R package ***openEBGM***, an implementation of the Gamma-Poisson Shrinker (GPS) model for identifying unexpected counts in large contingency tables using an empirical Bayes approach. The Empirical Bayes Geometric Mean (EBGM) and quantile scores are obtained from the GPS model estimates. ***openEBGM*** provides for the evaluation of counts using a number of different methods, including the model-based disproportionality scores, the relative reporting ratio (RR), and the proportional reporting ratio (PRR). Data squashing for computational efficiency and stratification for confounding variable adjustment are included. Application to adverse event detection is discussed.
Allele Imputation and Haplotype Determination from Databases Composed of Nuclear Families
The *alleHap* package is designed for imputing genetic missing data and reconstruct non-recombinant haplotypes from pedigree databases in a deterministic way. When genotypes of related individuals are available in a number of linked genetic markers, the program starts by identifying haplotypes compatible with the observed genotypes in those markers without missing values. If haplotypes are identified in parents or offspring, missing alleles can be imputed in subjects containing missing values. Several scenarios are analyzed: family completely genotyped, children partially genotyped and parents completely genotyped, children fully genotyped and parents containing entirely or partially missing genotypes, and founders and their offspring both only partially genotyped. The *alleHap* package also has a function to simulate pedigrees including all these scenarios. This article describes in detail how our package works for the desired applications, including illustrated explanations and easily reproducible examples.
rentrez: An R package for the NCBI eUtils API
The USA National Center for Biotechnology Information (NCBI) is one of the world's most important sources of biological information. NCBI databases like PubMed and GenBank contain millions of records describing bibliographic, genetic, genomic, and medical data. Here I present *rentrez*, a package which provides an R interface to 50 NCBI databases. The package is well-documented, contains an extensive suite of unit tests and has an active user base. The programmatic interface to the NCBI provided by *rentrez* allows researchers to query databases and download or import particular records into R sessions for subsequent analysis. The complete nature of the package, its extensive test-suite and the fact the package implements the NCBI's usage policies all make *rentrez* a powerful aid to developers of new packages that perform more specific tasks.
Splitting It Up: The spduration Split-Population Duration Regression Package for Time-Varying Covariates
We present an implementation of split-population duration regression in the *spduration* [@beger2016spduration] package for R that allows for time-varying covariates. The statistical model accounts for units that are immune to a certain outcome and are not part of the duration process the researcher is primarily interested in. We provide insights for when immune units exist, that can significantly increase the predictive performance compared to standard duration models. The package includes estimation and several post-estimation methods for split-population Weibull and log-logistic models. We provide an empirical application to data on military coups.
mle.tools: An R Package for Maximum Likelihood Bias Correction
Recently, [@mazucheli-mletools] uploaded the package *mle.tools* to CRAN. It can be used for bias corrections of maximum likelihood estimates through the methodology proposed by [@MR0237052]. The main function of the package, `coxsnell.bc()`, computes the bias corrected maximum likelihood estimates. Although in general, the bias corrected estimators may be expected to have better sampling properties than the uncorrected estimators, analytical expressions from the formula proposed by [@MR0237052] are either tedious or impossible to obtain. The purpose of this paper is twofolded: to introduce the *mle.tools* package, especially the `coxsnell.bc()` function; secondly, to compare, for thirty one continuous distributions, the bias estimates from the `coxsnell.bc()` function and the bias estimates from analytical expressions available in the literature. We also compare, for five distributions, the observed and expected Fisher information. Our numerical experiments show that the functions are efficient to estimate the biases by the Cox-Snell formula and for calculating the observed and expected Fisher information.
ider: Intrinsic Dimension Estimation with R
In many data analyses, the dimensionality of the observed data is high while its intrinsic dimension remains quite low. Estimating the intrinsic dimension of an observed dataset is an essential preliminary step for dimensionality reduction, manifold learning, and visualization. This paper introduces an R package, named [*ider*](https://CRAN.R-project.org/package=ider), that implements eight intrinsic dimension estimation methods, including a recently proposed method based on a second-order expansion of a probability mass function and a generalized linear model. The usage of each function in the package is explained with datasets generated using a function that is also included in the package.
BayesBD: An R Package for Bayesian Inference on Image Boundaries
We present the *BayesBD* package providing Bayesian inference for boundaries of noisy images. The *BayesBD* package implements flexible Gaussian process priors indexed by the circle to recover the boundary in a binary or Gaussian noised image. The boundary recovered by *BayesBD* has the practical advantages of guaranteed geometric restrictions and convenient joint inferences under certain assumptions, in addition to its desirable theoretical property of achieving (nearly) minimax optimal rate in a way that is adaptive to the unknown smoothness. The core sampling tasks for our model have linear complexity, and are implemented in C++ for computational efficiency using packages *Rcpp* and *RcppArmadillo*. Users can access the full functionality of the package in both the command line and the corresponding *shiny* application. Additionally, the package includes numerous utility functions to aid users in data preparation and analysis of results. We compare *BayesBD* with selected existing packages using both simulations and real data applications, demonstrating the excellent performance and flexibility of *BayesBD* even when the observation contains complicated structural information that may violate its assumptions.
Simulating Noisy, Nonparametric, and Multivariate Discrete Patterns
Requiring no analytical forms, nonparametric discrete patterns are flexible in representing complex relationships among random variables. This makes them increasingly useful for data-driven applications. However, there appears to be no software tools for simulating nonparametric discrete patterns, which prevents objective evaluation of statistical methods that discover discrete relationships from data. We present a simulator to generate nonparametric discrete functions as contingency tables. User can request strictly many-to-one functional patterns. The simulator can also produce contingency tables representing dependent non-functional and independent relationships. An option is provided to apply random noise to contingency tables. We demonstrate the utility of the simulator by showing the advantage of the FunChisq test over Pearson's chi-square test in detecting functional patterns. This simulator, implemented in the function `simulate_tables` in the R package *FunChisq* (version 2.4.0 or greater), offers an important means to evaluate the performance of nonparametric statistical pattern discovery methods.
Visualization of Regression Models Using visreg
Regression models allow one to isolate the relationship between the outcome and an explanatory variable while the other variables are held constant. Here, we introduce an R package, *visreg*, for the convenient visualization of this relationship via short, simple function calls. In addition to estimates of this relationship, the package also provides pointwise confidence bands and partial residuals to allow assessment of variability as well as outliers and other deviations from modeling assumptions. The package provides several options for visualizing models with interactions, including lattice plots, contour plots, and both static and interactive perspective plots. The implementation of the package is designed to be fully object-oriented and interface seamlessly with R's rich collection of model classes, allowing a consistent interface for visualizing not only linear models, but generalized linear models, proportional hazards models, generalized additive models, robust regression models, and many more.
arulesViz: Interactive Visualization of Association Rules with R
Association rule mining is a popular data mining method to discover interesting relationships between variables in large databases. An extensive toolbox is available in the R-extension package *arules*. However, mining association rules often results in a vast number of found rules, leaving the analyst with the task to go through a large set of rules to identify interesting ones. Sifting manually through extensive sets of rules is time-consuming and strenuous. Visualization and especially interactive visualization has a long history of making large amounts of data better accessible. The R-extension package *arulesViz* provides most popular visualization techniques for association rules. In this paper, we discuss recently added interactive visualizations to explore association rules and demonstrate how easily they can be used in *arulesViz* via a unified interface. With examples, we help to guide the user in selecting appropriate visualizations and interpreting the results.
liureg: A Comprehensive R Package for the Liu Estimation of Linear Regression Model with Collinear Regressors
The Liu regression estimator is now a commonly used alternative to the conventional ordinary least squares estimator that avoids the adverse effects in the situations when there exists a considerable degree of multicollinearity among the regressors. There are only a few software packages available for estimation of the Liu regression coefficients, though with limited methods to estimate the Liu biasing parameter without addressing testing procedures. Our *liureg* package can be used to estimate the Liu regression coefficients utilizing a range of different existing biasing parameters, to test these coefficients with more than 15 Liu related statistics, and to present different graphical displays of these statistics.
The welchADF Package for Robust Hypothesis Testing in Unbalanced Multivariate Mixed Models with Heteroscedastic and Non-normal Data
A new R package is presented for dealing with non-normality and variance heterogeneity of sample data when conducting hypothesis tests of main effects and interactions in mixed models. The proposal departs from an existing SAS program which implements Johansen's general formulation of Welch-James's statistic with approximate degrees of freedom, which makes it suitable for testing any linear hypothesis concerning cell means in univariate and multivariate mixed model designs when the data pose non-normality and non-homogeneous variance. Improved type I error rate control is obtained using bootstrapping for calculating an empirical critical value, whereas robustness against non-normality is achieved through trimmed means and Winsorized variances. A wrapper function eases the application of the test in common situations, such as performing omnibus tests on all effects and interactions, pairwise contrasts, and tetrad contrasts of two-way interactions. The package is demonstrated in several problems including unbalanced univariate and multivariate designs.
Bayesian Regression Models for Interval-censored Data in R
The package ***icenReg*** provides classic survival regression models for interval-censored data. We present an update to the package that extends the parametric models into the Bayesian framework. Core additions include functionality to define the regression model with the standard regression syntax while providing a custom prior function. Several other utility functions are presented that allow for simplified examination of the posterior distribution.
queueing: A Package For Analysis Of Queueing Networks and Models in R
queueing is a package that solves and provides the main performance measures for both basic Markovian queueing models and single and multiclass product-form queueing networks. It can be used both in education and for professional purposes. It provides an intuitive, straightforward way to build queueing models using S3 methods. The package solves Markovian models of the form M/M/c/K/M/FCFS, open and closed single class Jackson networks, open and closed multiclass networks and mixed networks. Markovian models are used when both the customer inter-arrival time and the server processing time are exponentially distributed. Queueing network solvers are useful for modelling situations in which more than one station must be visited.
fourierin: An R package to compute Fourier integrals
We present the R package *fourierin* [@basulto2016fourierin] for evaluating functions defined as Fourier-type integrals over a collection of argument values. The integrals are finitely supported with integrands involving continuous functions of one or two variables. As an important application, such Fourier integrals arise in so-called "inversion formulas", where one seeks to evaluate a probability density at a series of points from a given characteristic function (or vice versa) through Fourier transforms. This paper intends to fill a gap in current R software, where tools for repeated evaluation of functions as Fourier integrals are not directly available. We implement two approaches for such computations with numerical integration. In particular, if the argument collection for evaluation corresponds to a regular grid, then an algorithm from @inverarity2002fast may be employed based on a fast Fourier transform, which creates significant improvements in the speed over a second approach to numerical Fourier integration (where the latter also applies to cases where the points for evaluation are not on a grid). We illustrate the package with the computation of probability densities and characteristic functions through Fourier integrals/transforms, for both univariate and bivariate examples.
afmToolkit: an R Package for Automated AFM Force-Distance Curves Analysis
Atomic force microscopy (AFM) is widely used to measure molecular and colloidal interactions as well as mechanical properties of biomaterials. In this paper the *afmToolkit* R package is introduced. This package allows the user to automatically batch process AFM force-distance and force-time curves. *afmToolkit* capabilities range from importing ASCII files and preprocessing the curves (contact point detection, baseline correction...) for finding relevant physical information, such as Young's modulus, adhesion energies and exponential decay for force relaxation and creep experiments. This package also contains plotting, summary and feature extraction functions. The package also comes with several data sets so the user can test the aforementioned features with ease. The package *afmToolkit* eases the basic processing of large amount of AFM F-d/t curves at once. It is also flexible enough to easily incorporate new functions as they are needed and can be seen as a programming infrastructure for further algorithm development.
adegraphics: An S4 Lattice-Based Package for the Representation of Multivariate Data
The *ade4* package provides tools for multivariate analyses. Whereas new statistical methods have been added regularly in the package since its first release in 2002, the graphical functions, that are used to display the main outputs of an analysis, have not benefited from such enhancements. In this context, the *adegraphics* package, available on CRAN since 2015, is a complete reimplementation of the *ade4* graphical functionalities but with large improvements. The package uses the S4 object system (each graph is an object) and is based on the graphical framework provided by *lattice* and *grid*. We give a brief description of the package and illustrate some important functionalities to build elegant graphs.
LeArEst: Length and Area Estimation from Data Measured with Additive Error
This paper describes an R package ***LeArEst*** that can be used for estimating object dimensions from a noisy image. The package is based on a simple parametric model for data that are drawn from uniform distribution contaminated by an additive error. Our package is able to estimate the length of the object of interest on a given straight line that intersects it, as well as to estimate the object area when it is elliptically shaped. The input data may be a numerical vector or an image in JPEG format. In this paper, background statistical models and methods for the package are summarized, and the algorithms and key functions implemented are described. Also, examples that demonstrate its usage are provided.\ **Availability:** ***LeArEst*** is available on CRAN.
dGAselID: An R Package for Selecting a Variable Number of Features in High Dimensional Data
The *dGAselID* package proposes an original approach to feature selection in high dimensional data. The method is built upon a diploid genetic algorithm. The genotype to phenotype mapping is modeled after the Incomplete Dominance Inheritance, overpassing the necessity to define a dominance scheme. The fitness evaluation is done by user selectable supervised classifiers, from a broad range of options. Cross validation options are also accessible. A new approach to crossover, inspired from the random assortment of chromosomes during meiosis is included. Several mutation operators, inspired from genetics, are also proposed. The package is fully compatible with the data formats used in *Bioconductor* and *MLInterfaces* package, readily applicable to microarray studies, but is flexible to other feature selection applications from high dimensional data. Several options for the visualization of evolution and outcomes are implemented to facilitate the interpretation of results. The package's functionality is illustrated by examples.
CRTgeeDR: an R Package for Doubly Robust Generalized Estimating Equations Estimations in Cluster Randomized Trials with Missing Data
Semi-parametric approaches based on generalized estimating equations (GEE) are widely used to analyze correlated outcomes in longitudinal settings. In this paper, we present a package *CRTgeeDR* developed for cluster randomized trials with missing data (CRTs). For use of inverse probability weighting to adjust for missing data in cluster randomized trials, we show that other software lead to biased estimation for non-independence working correlation structure. *CRTgeeDR* solves this problem. We also extend the ability of existing packages to allow augmented Doubly Robust GEE estimation (DR). Simulation studies demonstrate the consistency of estimators implemented in *CRTgeeDR* compared to packages such as *geepack* and the gains associated with the use of the DR for analyzing a binary outcome using a logistic regression. Finally, we illustrate the method on data from a sanitation CRT in developing countries.
anomalyDetection: Implementation of Augmented Network Log Anomaly Detection Procedures
As the number of cyber-attacks continues to grow on a daily basis, so does the delay in threat detection. For instance, in 2015, the Office of Personnel Management discovered that approximately 21.5 million individual records of Federal employees and contractors had been stolen. On average, the time between an attack and its discovery is more than 200 days. In the case of the OPM breach, the attack had been going on for almost a year. Currently, cyber analysts inspect numerous potential incidents on a daily basis, but have neither the time nor the resources available to perform such a task. *anomalyDetection* aims to curtail the time frame in which anomalous cyber activities go unnoticed and to aid in the efficient discovery of these anomalous transactions among the millions of daily logged events by i) providing an efficient means for pre-processing and aggregating cyber data for analysis by employing a tabular vector transformation and handling multicollinearity concerns; ii) offering numerous built-in multivariate statistical functions such as Mahalanobis distance, factor analysis, principal components analysis to identify anomalous activity, iii) incorporating the pipe operator (`%>%`) to allow it to work well in the *tidyverse* workflow. Combined, *anomalyDetection* offers cyber analysts an efficient and simplified approach to break up network events into time-segment blocks and identify periods associated with suspected anomalies for further evaluation.
ctmcd: An R Package for Estimating the Parameters of a Continuous-Time Markov Chain from Discrete-Time Data
This article introduces the R package *ctmcd*, which provides an implementation of methods for the estimation of the parameters of a continuous-time Markov chain given that data are only available on a discrete-time basis. This data consists of partial observations of the state of the chain, which are made without error at discrete times, an issue also known as the embedding problem for Markov chains. The functions provided comprise matrix logarithm based approximations as described in @Israel01, as well as @Kreinin01, an expectation-maximization algorithm and a Gibbs sampling approach, both introduced by @Bladt05. For the expectation-maximization algorithm Wald confidence intervals based on the Fisher information estimation method of @Oakes99 are provided. For the Gibbs sampling approach, equal-tailed credibility intervals can be obtained. In order to visualize the parameter estimates, a matrix plot function is provided. The methods described are illustrated by Standard and Poor's discrete-time corporate credit rating transition data.
Discrete Time Markov Chains with R
The [*markovchain*](https://CRAN.R-project.org/package=markovchain) package aims to provide S4 classes and methods to easily handle Discrete Time Markov Chains (DTMCs), filling the gap with what is currently available in the CRAN repository. In this work, I provide an exhaustive description of the main functions included in the package, as well as hands-on examples.
Furniture for Quantitative Scientists
A basic understanding of the distributions of study variables and the relationships among them is essential to inform statistical modeling. This understanding is achieved through the computation of summary statistics and exploratory data analysis. Unfortunately, this step tends to be under-emphasized in the research process, in part because of the often tedious nature of thorough exploratory data analysis. The `table1()` function in the *furniture* package streamlines much of the exploratory data analysis process, making the computation and communication of summary statistics simple and beautiful while offering significant time-savings to the researcher.
anchoredDistr: a Package for the Bayesian Inversion of Geostatistical Parameters with Multi-type and Multi-scale Data
The Method of Anchored Distributions (MAD) is a method for Bayesian inversion designed for inferring both local (e.g. point values) and global properties (e.g. mean and variogram parameters) of spatially heterogenous fields using multi-type and multi-scale data. Software implementations of MAD exist in C++ and C# to import data, execute an ensemble of forward model simulations, and perform basic post-processing of calculating likelihood and posterior distributions for a given application. This article describes the R package *anchoredDistr* that has been built to provide an R-based environment for this method. In particular, *anchoredDistr* provides a range of post-processing capabilities for MAD software by taking advantage of the statistical capabilities and wide use of the R language. Two examples from stochastic hydrogeology are provided to highlight the features of the package for MAD applications in inferring anchored distributions of local parameters (e.g. point values of transmissivity) as well as global parameters (e.g. the mean of the spatial random function for hydraulic conductivity).
A Tidy Data Model for Natural Language Processing using cleanNLP
Recent advances in natural language processing have produced libraries that extract low-level features from a collection of raw texts. These features, known as annotations, are usually stored internally in hierarchical, tree-based data structures. This paper proposes a data model to represent annotations as a collection of normalized relational data tables optimized for exploratory data analysis and predictive modeling. The R package *cleanNLP*, which calls one of two state of the art NLP libraries (CoreNLP or spaCy), is presented as an implementation of this data model. It takes raw text as an input and returns a list of normalized tables. Specific annotations provided include tokenization, part of speech tagging, named entity recognition, sentiment analysis, dependency parsing, coreference resolution, and word embeddings. The package currently supports input text in English, German, French, and Spanish.
PGEE: An R Package for Analysis of Longitudinal Data with High-Dimensional Covariates
We introduce an R package *PGEE* that implements the penalized generalized estimating equations (GEE) procedure proposed by @wang2012penalized to analyze longitudinal data with a large number of covariates. The *PGEE* package includes three main functions: `CVfit`, `PGEE`, and `MGEE`. The `CVfit` function computes the cross-validated tuning parameter for penalized generalized estimating equations. The function `PGEE` performs simultaneous estimation and variable selection for longitudinal data with high-dimensional covariates; whereas the function `MGEE` fits unpenalized GEE to the data for comparison. The R package *PGEE* is illustrated using a yeast cell-cycle gene expression data set.
minval: An R package for MINimal VALidation of Stoichiometric Reactions
A genome-scale metabolic reconstruction is a compilation of all stoichiometric reactions that can describe the entire cellular metabolism of an organism, and they have become an indispensable tool for our understanding of biological phenomena, covering fields that range from systems biology to bioengineering. Interrogation of metabolic reconstructions are generally carried through Flux Balance Analysis, an optimization method in which the biological sense of the optimal solution is highly sensitive to thermodynamic unbalance caused by the presence of stoichiometric reactions whose compounds are not produced or consumed in any other reaction (orphan metabolites) and by mass unbalance. The *minval* package was designed as a tool to identify orphan metabolites and evaluate the mass and charge balance of stoichiometric reactions. The package also includes functions to characterize and write models in TSV and SBML formats, extract all reactants, products, metabolite names and compartments from a metabolic reconstruction.
Working with Daily Climate Model Output Data in R and the futureheatwaves Package
Research on climate change impacts can require extensive processing of climate model output, especially when using ensemble techniques to incorporate output from multiple climate models and multiple simulations of each model. This processing can be particularly extensive when identifying and characterizing multi-day extreme events like heat waves and frost day spells, as these must be processed from model output with daily time steps. Further, climate model output is in a format and follows standards that may be unfamiliar to most R users. Here, we provide an overview of working with daily climate model output data in R. We then present the *futureheatwaves* package, which we developed to ease the process of identifying, characterizing, and exploring multi-day extreme events in climate model output. This package can input a directory of climate model output files, identify all extreme events using customizable event definitions, and summarize the output using user-specified functions.
Counterfactual: An R Package for Counterfactual Analysis
The *Counterfactual* package implements the estimation and inference methods of @ChernozhukovFernandez-ValMelly2013 for counterfactual analysis. The counterfactual distributions considered are the result of changing either the marginal distribution of covariates related to the outcome variable of interest, or the conditional distribution of the outcome given the covariates. They can be applied to estimate quantile treatment effects and wage decompositions. This paper serves as an introduction to the package and displays basic functionality of the commands contained within.
flan: An R Package for Inference on Mutation Models.
This paper describes *flan*, a package providing tools for fluctuation analysis of mutant cell counts. It includes functions dedicated to the distribution of final numbers of mutant cells. Parametric estimation and hypothesis testing are also implemented, enabling inference on different sorts of data with several possible methods. An overview of the subject is proposed. The general form of mutation models is described, including the classical models as particular cases. Estimating from a model, when the data have been generated by another, induces different possible biases, which are identified and discussed. The three estimation methods available in the package are described, and their mean squared errors are compared. Finally, implementation is discussed, and a few examples of usage on real data sets are given.
checkmate: Fast Argument Checks for Defensive R Programming
Dynamically typed programming languages like R allow programmers to write generic, flexible and concise code and to interact with the language using an interactive Read-eval-print-loop (REPL). However, this flexibility has its price: As the R interpreter has no information about the expected variable type, many base functions automatically convert the input instead of raising an exception. Unfortunately, this frequently leads to runtime errors deeper down the call stack which obfuscates the original problem and renders debugging challenging. Even worse, unwanted conversions can remain undetected and skew or invalidate the results of a statistical analysis. As a resort, assertions can be employed to detect unexpected input during runtime and to signal understandable and traceable errors. The package *checkmate* provides a plethora of functions to check the type and related properties of the most frequently used R objects and variable types. The package is mostly written in C to avoid any unnecessary performance overhead. Thus, the programmer can conveniently write concise, well-tested assertions which outperforms custom R code for many applications. Furthermore, *checkmate* simplifies writing unit tests using the framework *testthat* [@wickham_2011] by extending it with plenty of additional expectation functions, and registered C routines are available for package developers to perform assertions on arbitrary SEXPs (internal data structure for R objects implemented as struct in C) in compiled code.
iotools: High-Performance I/O Tools for R
The *iotools* package provides a set of tools for input and output intensive data processing in R. The functions `chunk.apply` and `read.chunk` are supplied to allow for iteratively loading contiguous blocks of data into memory as raw vectors. These raw vectors can then be efficiently converted into matrices and data frames with the *iotools* functions `mstrsplit` and `dstrsplit`. These functions minimize copying of data and avoid the use of intermediate strings in order to drastically improve performance. Finally, we also provide `read.csv.raw` to allow users to read an entire dataset into memory with the same efficient parsing code. In this paper, we present these functions through a set of examples with an emphasis on the flexibility provided by chunk-wise operations. We provide benchmarks comparing the speed of `read.csv.raw` to data loading functions provided in base R and other contributed packages.
IsoGeneGUI: Multiple Approaches for Dose-Response Analysis of Microarray Data Using R
The analysis of transcriptomic experiments with ordered covariates, such as dose-response data, has become a central topic in bioinformatics, in particular in omics studies. Consequently, multiple R packages on CRAN and Bioconductor are designed to analyse microarray data from various perspectives under the assumption of order restriction. We introduce the new R package IsoGene Graphical User Interface (*IsoGeneGUI*), an extension of the original *IsoGene* package that includes methods from most of available R packages designed for the analysis of order restricted microarray data, namely *orQA*, *ORIClust*, *goric* and *ORCME*. The methods included in the new *IsoGeneGUI* range from inference and estimation to model selection and clustering tools. The *IsoGeneGUI* is not only the most complete tool for the analysis of order restricted microarray experiments available in R but also it can be used to analyse other types of dose-response data. The package provides all the methods in a user friendly fashion, so analyses can be implemented by users with limited knowledge of R programming.
OrthoPanels: An R Package for Estimating a Dynamic Panel Model with Fixed Effects Using the Orthogonal Reparameterization Approach
This article describes the R package *OrthoPanels*, which includes the function `opm()`. This function implements the orthogonal reparameterization approach recommended by [@Lancaster2002] to estimate dynamic panel models with fixed effects (and optionally: wave specific intercepts). This article provides a statistical description of the orthogonal reparameterization approach, a demonstration of the package using real-world data, and simulations comparing the estimator to the known-to-be-biased OLS estimator and the commonly used GMM estimator.
smoof: Single- and Multi-Objective Optimization Test Functions
Benchmarking algorithms for optimization problems usually is carried out by running the algorithms under consideration on a diverse set of benchmark or test functions. A vast variety of test functions was proposed by researchers and is being used for investigations in the literature. The *smoof* package implements a large set of test functions and test function generators for both the single- and multi-objective case in continuous optimization and provides functions to easily create own test functions. Moreover, the package offers some additional helper methods, which can be used in the context of optimization.
alineR: an R Package for Optimizing Feature-Weighted Alignments and Linguistic Distances
Linguistic distance measurements are commonly used in anthropology and biology when quantitative and statistical comparisons between words are needed. This is common, for example, when analyzing linguistic and genetic data. Such comparisons can provide insight into historical population patterns and evolutionary processes. However, the most commonly used linguistic distances are derived from edit distances, which do not weight phonetic features that may, for example, represent smaller-scale patterns in linguistic evolution. Thus, computational methods for calculating feature-weighted linguistic distances are needed for linguistic, biological, and evolutionary applications; additionally, the linguistic distances presented here are generic and may have broader applications in fields such as text mining and search, as well as applications in psycholinguistics and morphology. To facilitate this research, we are making available an open-source R software package that performs feature-weighted linguistic distance calculations. The package also includes a supervised learning methodology that uses a genetic algorithm and manually determined alignments to estimate 13 linguistic parameters including feature weights and a skip penalty. Here we present the package and use it to demonstrate the supervised learning methodology by estimating the optimal linguistic parameters for both simulated data and for a sample of Austronesian languages. Our results show that the methodology can estimate these parameters for both simulated and real language data, that optimizing feature weights improves alignment accuracy by approximately 29%, and that optimization significantly affects the resulting distance measurements. Availability: alineR is available on CRAN.
Implementing a Metapopulation Bass Diffusion Model using the R Package deSolve
Diffusion is a fundamental process in physical, biological, social and economic settings. Consumer products often go viral, with sales driven by the word of mouth effect, as their adoption spreads through a population. The classic diffusion model used for product adoption is the Bass diffusion model, and this divides a population into two groups of people: potential adopters who are likely to adopt a product, and adopters who have purchased the product, and influence others to adopt. The Bass diffusion model is normally captured in an aggregate form, where no significant consumer differences are modeled. This paper extends the Bass model to capture a spatial perspective, using metapopulation equations from the field of infectious disease modeling. The paper's focus is on simulation of deterministic models by solving ordinary differential equations, and does not encompass parameter estimation. The metapopulation model in implemented in R using the *deSolve* package, and shows the potential of using the R framework to implement large-scale integral equation models, with applications in the field of marketing and consumer behaviour.
MDplot: Visualise Molecular Dynamics
The *MDplot* package provides plotting functions to allow for automated visualisation of molecular dynamics simulation output. It is especially useful in cases where the plot generation is rather tedious due to complex file formats or when a large number of plots are generated. The graphs that are supported range from those which are standard, such as RMSD/RMSF (root-mean-square deviation and root-mean-square fluctuation, respectively) to less standard, such as thermodynamic integration analysis and hydrogen bond monitoring over time. All told, they address many commonly used analyses. In this article, we set out the *MDplot* package's functions, give examples of the function calls, and show the associated plots. Plotting and data parsing is separated in all cases, i.e. the respective functions can be used independently. Thus, data manipulation and the integration of additional file formats is fairly easy. Currently, the loading functions support GROMOS, GROMACS, and AMBER file formats. Moreover, we also provide a Bash interface that allows simple embedding of MDplot into Bash scripts as the final analysis step.
On Some Extensions to GA Package: Hybrid Optimisation, Parallelisation and Islands Evolution
Genetic algorithms are stochastic iterative algorithms in which a population of individuals evolve by emulating the process of biological evolution and natural selection. The R package *GA* provides a collection of general purpose functions for optimisation using genetic algorithms. This paper describes some enhancements recently introduced in version 3 of the package. In particular, hybrid GAs have been implemented by including the option to perform local searches during the evolution. This allows to combine the power of genetic algorithms with the speed of a local optimiser. Another major improvement is the provision of facilities for parallel computing. Parallelisation has been implemented using both the master-slave approach and the islands evolution model. Several examples of usage are presented, with both real-world data examples and benchmark functions, showing that often high-quality solutions can be obtained more efficiently.
imputeTS: Time Series Missing Value Imputation in R
The *imputeTS* package specializes on univariate time series imputation. It offers multiple state-of-the-art imputation algorithm implementations along with plotting functions for time series missing data statistics. While imputation in general is a well-known problem and widely covered by R packages, finding packages able to fill missing values in univariate time series is more complicated. The reason for this lies in the fact, that most imputation algorithms rely on inter-attribute correlations, while univariate time series imputation instead needs to employ time dependencies. This paper provides an introduction to the *imputeTS* package and its provided algorithms and tools. Furthermore, it gives a short overview about univariate time series imputation in R.
Update of the nlme Package to Allow a Fixed Standard Deviation of the Residual Error
The use of linear and non-linear mixed models in the life sciences and pharmacometrics is common practice. Estimation of the parameters of models not involving a system of differential equations is often done by the R or S-Plus software with the nonlinear mixed effects *nlme* package. The estimated residual error may be used for diagnosis of the fitted model, but not whether the model correctly describes the relation between response and included variables including the true covariance structure. The latter is only true if the residual error is known in advance. Therefore, it may be necessary or more appropriate to fix the residual error a priori instead of estimate its value. This can be the case if one wants to include evidence from past studies or a theoretical derivation; e.g., when using a binomial model. S-Plus has an option to fix this residual error to a constant, in contrast to R. For convenience, the *nlme* package was customized to offer this option as well. In this paper, we derived the log-likelihoods for the mixed models using a fixed residual error. By using some well-known examples from mixed models, we demonstrated the equivalence of R and S-Plus with respect to the estimates. The updated package has been accepted by the Comprehensive R Archive Network (CRAN) team and will be available at the CRAN website.
EMSaov: An R Package for the Analysis of Variance with the Expected Mean Squares and its Shiny Application
*EMSaov* is a new R package that we developed to provide users with an analysis of variance table including the expected mean squares (EMS) for various types of experimental design. It is not easy to find the appropriate test, particularly the denominator for the F statistic that depends on the EMS, when some variables exhibit random effects or when we use a special experimental design such as nested design, repeated measures design, or split-plot design. With *EMSaov*, a user can easily find the F statistic denominator and can determine how to analyze the data when using a special experimental design. We also develop a web application with a GUI interface using the *shiny* package in `R` . We expect that our application can contribute to the efficient and easy analysis of experimental data.
Multilabel Classification with R Package mlr
We implemented several multilabel classification algorithms in the machine learning package mlr. The implemented methods are binary relevance, classifier chains, nested stacking, dependent binary relevance and stacking, which can be used with any base learner that is accessible in mlr. Moreover, there is access to the multilabel classification versions of randomForestSRC and rFerns. All these methods can be easily compared by different implemented multilabel performance measures and resampling methods in the standardized mlr framework. In a benchmark experiment with several multilabel datasets, the performance of the different methods is evaluated.
milr: Multiple-Instance Logistic Regression with Lasso Penalty
The purpose of the *milr* package is to analyze multiple-instance data. Ordinary multiple-instance data consists of many independent bags, and each bag is composed of several instances. The statuses of bags and instances are binary. Moreover, the statuses of instances are not observed, whereas the statuses of bags are observed. The functions in this package are applicable for analyzing multiple-instance data, simulating data via logistic regression, and selecting important covariates in the regression model. To this end, maximum likelihood estimation with an expectation-maximization algorithm is implemented for model estimation, and a lasso penalty added to the likelihood function is applied for variable selection. Additionally, an `"milr"` object is applicable to generic functions `fitted`, `predict` and `summary`. Simulated data and a real example are given to demonstrate the features of this package.
spcadjust: An R Package for Adjusting for Estimation Error in Control Charts
In practical applications of control charts the in-control state and the corresponding chart parameters are usually estimated based on some past in-control data. The estimation error then needs to be accounted for. In this paper we present an R package, *spcadjust*, which implements a bootstrap based method for adjusting monitoring schemes to take into account the estimation error. By bootstrapping the past data this method guarantees, with a certain probability, a conditional performance of the chart. In *spcadjust* the method is implement for various types of Shewhart, CUSUM and EWMA charts, various performance criteria, and both parametric and non-parametric bootstrap schemes. In addition to the basic charts, charts based on linear and logistic regression models for risk adjusted monitoring are included, and it is easy for the user to add further charts. Use of the package is demonstrated by examples.
GsymPoint: An R Package to Estimate the Generalized Symmetry Point, an Optimal Cut-off Point for Binary Classification in Continuous Diagnostic Tests
In clinical practice, it is very useful to select an optimal cutpoint in the scale of a continuous biomarker or diagnostic test for classifying individuals as healthy or diseased. Several methods for choosing optimal cutpoints have been presented in the literature, depending on the ultimate goal. One of these methods, the generalized symmetry point, recently introduced, generalizes the symmetry point by incorporating the misclassification costs. Two statistical approaches have been proposed in the literature for estimating this optimal cutpoint and its associated sensitivity and specificity measures, a parametric method based on the generalized pivotal quantity and a nonparametric method based on empirical likelihood. In this paper, we introduce [*GsymPoint*](https://CRAN.R-project.org/package=GsymPoint), an R package that implements these methods in a user-friendly environment, allowing the end-user to calculate the generalized symmetry point depending on the levels of certain categorical covariates. The practical use of this package is illustrated using three real biomedical datasets.
pdp: An R Package for Constructing Partial Dependence Plots
Complex nonparametric models---like neural networks, random forests, and support vector machines---are more common than ever in predictive analytics, especially when dealing with large observational databases that don't adhere to the strict assumptions imposed by traditional statistical techniques (e.g., multiple linear regression which assumes linearity, homoscedasticity, and normality). Unfortunately, it can be challenging to understand the results of such models and explain them to management. Partial dependence plots offer a simple solution. Partial dependence plots are low-dimensional graphical renderings of the prediction function so that the relationship between the outcome and predictors of interest can be more easily understood. These plots are especially useful in explaining the output from black box models. In this paper, we introduce *pdp*, a general R package for constructing partial dependence plots.
Weighted Effect Coding for Observational Data with wec
Weighted effect coding refers to a specific coding matrix to include factor variables in generalised linear regression models. With weighted effect coding, the effect for each category represents the deviation of that category from the weighted mean (which corresponds to the sample mean). This technique has particularly attractive properties when analysing observational data, that commonly are unbalanced. The *wec* package is introduced, that provides functions to apply weighted effect coding to factor variables, and to interactions between (a.) a factor variable and a continuous variable and between (b.) two factor variables.
coxphMIC: An R Package for Sparse Estimation of Cox Proportional Hazards Models via Approximated Information Criteria
In this paper, we describe an R package named **coxphMIC**, which implements the sparse estimation method for Cox proportional hazards models via approximated information criterion [@Su:2016]. The developed methodology is named MIC which stands for "Minimizing approximated Information Criteria\". A reparameterization step is introduced to enforce sparsity while at the same time keeping the objective function smooth. As a result, MIC is computationally fast with a superior performance in sparse estimation. Furthermore, the reparameterization tactic yields an additional advantage in terms of circumventing post-selection inference [@Leeb:2005]. The MIC method and its R implementation are introduced and illustrated with the PBC data.
Retrieval and Analysis of Eurostat Open Data with the eurostat Package
The increasing availability of open statistical data resources is providing novel opportunities for research and citizen science. Efficient algorithmic tools are needed to realize the full potential of the new information resources. We introduce the *eurostat* R package that provides a collection of custom tools for the Eurostat open data service, including functions to query, download, manipulate, and visualize these data sets in a smooth, automated and reproducible manner. The online documentation provides detailed examples on the analysis of these spatio-temporal data collections. This work provides substantial improvements over the previously available tools, and has been extensively tested by an active user community. The *eurostat* R package contributes to the growing open source ecosystem dedicated to reproducible research in computational social science and digital humanities.
Market Area Analysis for Retail and Service Locations with MCI
In retail location analysis, marketing research and spatial planning, the market areas of stores and/or locations are a frequent subject. Market area analyses consist of empirical observations and modeling via theoretical and/or econometric models such as the Huff Model or the Multiplicative Competitive Interaction Model. The authors' package MCI implements the steps of market area analysis into R with a focus on fitting the models and data preparation and processing.
PSF: Introduction to R Package for Pattern Sequence Based Forecasting Algorithm
This paper introduces the R package that implements the Pattern Sequence based Forecasting (PSF) algorithm, which was developed for univariate time series forecasting. This algorithm has been successfully applied to many different fields. The PSF algorithm consists of two major parts: clustering and prediction. The clustering part includes selection of the optimum number of clusters. It labels time series data with reference to such clusters. The prediction part includes functions like optimum window size selection for specific patterns and prediction of future values with reference to past pattern sequences. The PSF package consists of various functions to implement the PSF algorithm. It also contains a function which automates all other functions to obtain optimized prediction results. The aim of this package is to promote the PSF algorithm and to ease its usage with minimum efforts. This paper describes all the functions in the PSF package with their syntax. It also provides a simple example. Finally, the usefulness of this package is discussed by comparing it to `auto.arima` and `ets`, well-known time series forecasting functions available on CRAN repository.
BayesBinMix: an R Package for Model Based Clustering of Multivariate Binary Data
The *BayesBinMix* package offers a Bayesian framework for clustering binary data with or without missing values by fitting mixtures of multivariate Bernoulli distributions with an unknown number of components. It allows the joint estimation of the number of clusters and model parameters using Markov chain Monte Carlo sampling. Heated chains are run in parallel and accelerate the convergence to the target posterior distribution. Identifiability issues are addressed by implementing label switching algorithms. The package is demonstrated and benchmarked against the Expectation-Maximization algorithm using a simulation study as well as a real dataset.
Network Visualization with ggplot2
This paper explores three different approaches to visualize networks by building on the grammar of graphics framework implemented in the *ggplot2* package. The goal of each approach is to provide the user with the ability to apply the flexibility of *ggplot2* to the visualization of network data, including through the mapping of network attributes to specific plot aesthetics. By incorporating networks in the *ggplot2* framework, these approaches (1) allow users to enhance networks with additional information on edges and nodes, (2) give access to the strengths of *ggplot2*, such as layers and facets, and (3) convert network data objects to the more familiar data frames.
The mosaic Package: Helping Students to 'Think with Data' Using R
The mosaic package provides a simplified and systematic introduction to the core functionality related to descriptive statistics, visualization, modeling, and simulation-based inference required in first and second courses in statistics. This introduction to the package describes some of the guiding principles behind the design of the package and provides illustrative examples of several of the most important functions it implements. These can be combined to help students "think with data\" using R in their early course work, starting with simple, yet powerful, declarative commands.
autoimage: Multiple Heat Maps for Projected Coordinates
Heat maps are commonly used to display the spatial distribution of a response observed on a two-dimensional grid. The *autoimage* package provides convenient functions for constructing multiple heat maps in unified, seamless way, particularly when working with projected coordinates. The *autoimage* package natively supports: 1. automatic inclusion of a color scale with the plotted image, 2. construction of heat maps for responses observed on regular or irregular grids, as well as non-gridded data, 3. construction of a matrix of heat maps with a common color scale, 4. construction of a matrix of heat maps with individual color scales, 5. projecting coordinates before plotting, 6. easily adding geographic borders, points, and other features to the heat maps. After comparing the *autoimage* package's capabilities for constructing heat maps to those of existing tools, a carefully selected set of examples is used to highlight the capabilities of the *autoimage* package.
Hosting Data Packages via drat: A Case Study with Hurricane Exposure Data
Data-only packages offer a way to provide extended functionality for other R users. However, such packages can be large enough to exceed the package size limit (5 megabytes) for the Comprehensive R Archive Network (CRAN). As an alternative, large data packages can be posted to additional repostiories beyond CRAN itself in a way that allows smaller code packages on CRAN to access and use the data. The *drat* package facilitates creation and use of such alternative repositories and makes it particularly simple to host them via GitHub. CRAN packages can draw on packages posted to *drat* repositories through the use of the 'Additonal_repositories' field in the DESCRIPTION file. This paper describes how R users can create a suite of coordinated packages, in which larger data packages are hosted in an alternative repository created with *drat*, while a smaller code package that interacts with this data is created that can be submitted to CRAN.
The NoiseFiltersR Package: Label Noise Preprocessing in R
In Data Mining, the value of extracted knowledge is directly related to the quality of the used data. This makes data preprocessing one of the most important steps in the knowledge discovery process. A common problem affecting data quality is the presence of noise. A training set with label noise can reduce the predictive performance of classification learning techniques and increase the overfitting of classification models. In this work we present the *NoiseFiltersR* package. It contains the first extensive R implementation of classical and state-of-the-art label noise filters, which are the most common techniques for preprocessing label noise. The algorithms used for the implementation of the label noise filters are appropriately documented and referenced. They can be called in a R-user-friendly manner, and their results are unified by means of the `"filter"` class, which also benefits from adapted `print` and `summary` methods.
rnrfa: An R package to Retrieve, Filter and Visualize Data from the UK National River Flow Archive
The UK National River Flow Archive (NRFA) stores several types of hydrological data and metadata: daily river flow and catchment rainfall time series, gauging station and catchment information. Data are served through the NRFA web services via experimental RESTful APIs. Obtaining NRFA data can be unwieldy due to complexities in handling HTTP GET requests and parsing responses in JSON and XML formats. The *rnrfa* package provides a set of functions to programmatically access, filter, and visualize NRFA data using simple R syntax. This paper describes the structure of the *rnrfa* package, including examples using the main functions `gdf()` and `cmr()` for flow and rainfall data, respectively. Visualization examples are also provided with a *shiny* web application and functions provided in the package. Although this package is regional specific, the general framework and structure could be applied to similar databases.
Normal Tolerance Interval Procedures in the *tolerance* Package
Statistical tolerance intervals are used for a broad range of applications, such as quality control, engineering design tests, environmental monitoring, and bioequivalence testing. *tolerance* is the only R package devoted to procedures for tolerance intervals and regions. Perhaps the most commonly-employed functions of the package involve normal tolerance intervals. A number of new procedures for this setting have been included in recent versions of *tolerance*. In this paper, we discuss and illustrate the functions that implement these normal tolerance interval procedures, one of which is a new, novel type of operating characteristic curve.
Computing Pareto Frontiers and Database Preferences with the rPref Package
The concept of Pareto frontiers is well-known in economics. Within the database community there exist many different solutions for the specification and calculation of Pareto frontiers, also called Skyline queries in the database context. Slight generalizations like the combination of the Pareto operator with the lexicographical order have been established under the term database preferences. In this paper we present the *rPref* package which allows to efficiently deal with these concepts within R. With its help, database preferences can be specified in a very similar way as in a state-of-the-art database management system. Our package provides algorithms for an efficient calculation of the Pareto-optimal set and further functionalities for visualizing and analyzing the induced preference order.
Weighted Distance Based Discriminant Analysis: The R Package WeDiBaDis
The *WeDiBaDis* package provides a user friendly environment to perform discriminant analysis (supervised classification). *WeDiBaDis* is an easy to use package addressed to the biological and medical communities, and in general, to researchers interested in applied studies. It can be suitable when the user is interested in the problem of constructing a discriminant rule on the basis of distances between a relatively small number of instances or units of known unbalanced-class membership measured on many (possibly thousands) features of any type. This is a current situation when analyzing genetic biomedical data. This discriminant rule can then be used both, as a means of explaining differences among classes, but also in the important task of assigning the class membership for new unlabeled units. Our package implements two discriminant analysis procedures in an R environment: the well-known distance-based discriminant analysis (DB-discriminant) and a weighted-distance-based discriminant (WDB-discriminant), a novel classifier rule that we introduce. This new procedure is based on an improvement of the DB rule taking into account the statistical depth of the units. This article presents both classifying procedures and describes the implementation of each in detail. We illustrate the use of the package using an ecological and a genetic experimental example. Finally, we illustrate the effectiveness of the new proposed procedure (WDB), as compared with DB. This comparison is carried out using thirty-eight, high-dimensional, class-unbalanced, cancer data sets, three of which include clinical features.
condSURV: An R Package for the Estimation of the Conditional Survival Function for Ordered Multivariate Failure Time Data
One major goal in clinical applications of time-to-event data is the estimation of survival with censored data. The usual nonparametric estimator of the survival function is the time-honored Kaplan-Meier product-limit estimator. Though this estimator has been implemented in several R packages, the development of the *condSURV* R package has been motivated by recent contributions that allow the estimation of the survival function for ordered multivariate failure time data. The *condSURV* package provides three different approaches all based on the Kaplan-Meier estimator. In one of these approaches these quantities are estimated conditionally on current or past covariate measures. Illustration of the software usage is included using real data.
easyROC: An Interactive Web-tool for ROC Curve Analysis Using R Language Environment
ROC curve analysis is a fundamental tool for evaluating the performance of a marker in a number of research areas, e.g., biomedicine, bioinformatics, engineering etc., and is frequently used for discriminating cases from controls. There are a number of analysis tools which are used to guide researchers through their analysis. Some of these tools are commercial and provide basic methods for ROC curve analysis while others offer advanced analysis techniques and a command-based user interface, such as the R environment. The R environmentg includes comprehensive tools for ROC curve analysis; however, using a command-based interface might be challenging and time consuming when a quick evaluation is desired; especially for non-R users, physicians etc. Hence, a quick, comprehensive, free and easy-to-use analysis tool is required. For this purpose, we developed a user-friendly web-tool based on the R language. This tool provides ROC statistics, graphical tools, optimal cutpoint calculation, comparison of several markers, and sample size estimation to support researchers in their decisions without writing R codes. easyROC can be used via any device with an internet connection independently of the operating system. The web interface of easyROC is constructed with the R package *shiny*. This tool is freely available through [www.biosoft.hacettepe.edu.tr/easyROC](http://www.biosoft.hacettepe.edu.tr/easyROC){.uri}.
diverse: an R Package to Analyze Diversity in Complex Systems
The package *diverse* provides an easy-to-use interface to calculate and visualize different aspects of diversity in complex systems. In recent years, an increasing number of research projects in social and interdisciplinary sciences, including fields like innovation studies, scientometrics, economics, and network science have emphasized the role of diversification and sophistication of socioeconomic systems. However, so far no dedicated package exists that covers the needs of these emerging fields and interdisciplinary teams. Most packages about diversity tend to be created according to the demands and terminology of particular areas of natural and biological sciences. The package *diverse* uses interdisciplinary concepts of diversity---like variety, disparity and balance--- as well as ubiquity and revealed comparative advantages, that are relevant to many fields of science, but are in particular useful for interdisciplinary research on diversity in socioeconomic systems. The package *diverse* provides a toolkit for social scientists, interdisciplinary researcher, and beginners in ecology to (i) import data, (ii) calculate different data transformations and normalization like revealed comparative advantages, (iii) calculate different diversity measures, and (iv) connect *diverse* to other specialized R packages on similarity measures, data visualization techniques, and statistical significance tests. The comprehensiveness of the package, from matrix import and transformations options, over similarity and diversity measures, to data visualization methods, makes it a useful package to explore different dimensions of diversity in complex systems.
Qtools: A Collection of Models and Tools for Quantile Inference
Quantiles play a fundamental role in statistics. The quantile function defines the distribution of a random variable and, thus, provides a way to describe the data that is specular but equivalent to that given by the corresponding cumulative distribution function. There are many advantages in working with quantiles, starting from their properties. The renewed interest in their usage seen in the last years is due to the theoretical, methodological, and software contributions that have broadened their applicability. This paper presents the R package *Qtools*, a collection of utilities for unconditional and conditional quantiles.
Ake: An R Package for Discrete and Continuous Associated Kernel Estimations
Kernel estimation is an important technique in exploratory data analysis. Its utility relies on its ease of interpretation, especially based on graphical means. The *Ake* package is introduced for univariate density or probability mass function estimation and also for continuous and discrete regression functions using associated kernel estimators. These associated kernels have been proposed due to their specific features of variables of interest. The package focuses on associated kernel methods appropriate for continuous (bounded, positive) or discrete (count, categorical) data often found in applied settings. Furthermore, optimal bandwidths are selected by cross-validation for any associated kernel and by Bayesian methods for the binomial kernel. Other Bayesian methods for selecting bandwidths with other associated kernels will complete this package in its future versions; particularly, a Bayesian adaptive method for gamma kernel estimation of density functions is developed. Some practical and theoretical aspects of the normalizing constant in both density and probability mass functions estimations are given.
water: Tools and Functions to Estimate Actual Evapotranspiration Using Land Surface Energy Balance Models in R
The crop water requirement is a key factor in the agricultural process. It is usually estimated throughout actual evapotranspiration ($ET_a$). This parameter is the key to develop irrigation strategies, to improve water use efficiency and to understand hydrological, climatic, and ecosystem processes. Currently, it is calculated with classical methods, which are difficult to extrapolate, or with land surface energy balance models (LSEB), such as METRIC and SEBAL, which are based on remote sensing data. This paper describes *water*, an open implementation of LSEB. The package provides several functions to estimate the parameters of the LSEB equation from satellite data and proposes a new object class to handle weather station data. One of the critical steps in METRIC is the selection of "cold" and "hot" pixels, which *water* solves with an automatic method. The *water* package can process a batch of satellite images and integrates most of the already published sub-models for METRIC. Although *water* implements METRIC, it will be expandable to SEBAL and others in the near future. Finally, two different procedures are demonstrated using data that is included in *water* package.
Measurement Units in R
We briefly review SI units, and discuss R packages that deal with measurement units, their compatibility and conversion. Built upon *udunits2* and the UNIDATA udunits library, we introduce the package *units* that provides a class for maintaining unit metadata. When used in expression, it automatically converts units, and simplifies units of results when possible; in case of incompatible units, errors are raised. The class flexibly allows expansion beyond predefined units. Using *units* may eliminate a whole class of potential scientific programming mistakes. We discuss the potential and limitations of computing with explicit units.
mctest: An R Package for Detection of Collinearity among Regressors
It is common for linear regression models to be plagued with the problem of multicollinearity when two or more regressors are highly correlated. This problem results in unstable estimates of regression coefficients and causes some serious problems in validation and interpretation of the model. Different diagnostic measures are used to detect multicollinearity among regressors. Many statistical software and R packages provide few diagnostic measures for the judgment of multicollinearity. Most widely used diagnostic measures in these software are: coefficient of determination ($R^2$), variance inflation factor/tolerance limit (VIF/TOL), eigenvalues, condition number (CN) and condition index (CI) etc. In this manuscript, we present an R package, *mctest*, that computes popular and widely used multicollinearity diagnostic measures. The package also indicates which regressors may be the reason of collinearity among regressors.
Escape from Boxland
A library of common geometric shapes can be used to train our brains for understanding data structure in high-dimensional Euclidean space. This article describes the methods for producing cubes, spheres, simplexes, and tori in multiple dimensions. It also describes new ways to define and generate high-dimensional tori. The algorithms are described, critical code chunks are given, and a large collection of generated data are provided. These are available in the R package *geozoo*, and selected movies and images, are available on the GeoZoo web site (<http://schloerke.github.io/geozoo/>).
An Introduction to Principal Surrogate Evaluation with the pseval Package
We describe a new package called *pseval* that implements the core methods for the evaluation of principal surrogates in a single clinical trial. It provides a flexible interface for defining models for the risk given treatment and the surrogate, the models for integration over the missing counterfactual surrogate responses, and the estimation methods. Estimated maximum likelihood and pseudo-score can be used for estimation, and the bootstrap for inference. A variety of post-estimation methods are provided, including print, summary, plot, and testing. We summarize the main statistical methods that are implemented in the package and illustrate its use from the perspective of a novice R user.
quantreg.nonpar: An R Package for Performing Nonparametric Series Quantile Regression
The R package quantreg.nonpar implements nonparametric quantile regression methods to estimate and make inference on partially linear quantile models. quantreg.nonpar obtains point estimates of the conditional quantile function and its derivatives based on series approximations to the nonparametric part of the model. It also provides pointwise and uniform confidence intervals over a region of covariate values and/or quantile indices for the same functions using analytical and resampling methods. This paper serves as an introduction to the package and displays basic functionality of the functions contained within.
nmfgpu4R: GPU-Accelerated Computation of the Non-Negative Matrix Factorization (NMF) Using CUDA Capable Hardware
In this work, a novel package called *nmfgpu4R* is presented, which offers the computation of *Non-negative Matrix Factorization (NMF)* on *Compute Unified Device Architecture (CUDA)* platforms within the R environment. Benchmarks show a remarkable speed-up in terms of time per iteration by utilizing the parallelization capabilities of modern graphics cards. Therefore the application of NMF gets more attractive for real-world sized problems because the time to compute a factorization is reduced by an order of magnitude.
micompr: An R Package for Multivariate Independent Comparison of Observations
The R package *micompr* implements a procedure for assessing if two or more multivariate samples are drawn from the same distribution. The procedure uses principal component analysis to convert multivariate observations into a set of linearly uncorrelated statistical measures, which are then compared using a number of statistical methods. This technique is independent of the distributional properties of samples and automatically selects features that best explain their differences. The procedure is appropriate for comparing samples of time series, images, spectrometric measures or similar high-dimension multivariate observations.
Design of the TRONCO BioConductor Package for TRanslational ONCOlogy
Models of cancer progression provide insights on the order of accumulation of genetic alterations during cancer development. Algorithms to infer such models from the currently available mutational profiles collected from different cancer patients (*cross-sectional data*) have been defined in the literature since late the 90s. These algorithms differ in the way they extract a *graphical model* of the events modelling the progression, e.g., somatic mutations or copy-number alterations.\ *TRONCO* is an [R]{.smallcaps} package for TRanslational ONcology which provides a series of functions to assist the user in the analysis of cross-sectional genomic data and, in particular, it implements algorithms that aim to model cancer progression by means of the notion of selective advantage. These algorithms are proved to outperform the current state-of-the-art in the inference of cancer progression models. *TRONCO* also provides functionalities to load input cross-sectional data, set up the execution of the algorithms, assess the statistical confidence in the results, and visualize the models. Availability. Freely available at <http://www.bioconductor.org/> under GPL license; project hosted at <http://bimib.disco.unimib.it/> and <https://github.com/BIMIB-DISCo/TRONCO>.\ Contact. [tronco@disco.unimib.it](tronco@disco.unimib.it)
Variants of Simple Correspondence Analysis
This paper presents the R package *CAvariants* [@CAvariants]. The package performs six variants of correspondence analysis on a two-way contingency table. The main function that shares the same name as the package -- `CAvariants` -- allows the user to choose (via a series of input parameters) from six different correspondence analysis procedures. These include the classical approach to (symmetrical) correspondence analysis, singly ordered correspondence analysis, doubly ordered correspondence analysis, non symmetrical correspondence analysis, singly ordered non symmetrical correspondence analysis and doubly ordered non symmetrical correspondence analysis. The code provides the flexibility for constructing either a classical correspondence plot or a biplot graphical display. It also allows the user to consider other important features that allow to assess the reliability of the graphical representations, such as the inclusion of algebraically derived elliptical confidence regions. This paper provides R functions that elaborates more fully on the code presented in @behlom14.
Calculating Biological Module Enrichment or Depletion and Visualizing Data on Large-scale Molecular Maps with ACSNMineR and Packages
Biological pathways or modules represent sets of interactions or functional relationships occurring at the molecular level in living cells. A large body of knowledge on pathways is organized in public databases such as the KEGG, Reactome, or in more specialized repositories, the Atlas of Cancer Signaling Network (ACSN) being an example. All these open biological databases facilitate analyses, improving our understanding of cellular systems. We hereby describe *ACSNMineR* for calculation of enrichment or depletion of lists of genes of interest in biological pathways. *ACSNMineR* integrates ACSN molecular pathways gene sets, but can use any gene set encoded as a GMT file, for instance sets of genes available in the Molecular Signatures Database (MSigDB). We also present *RNaviCell*, that can be used in conjunction with *ACSNMineR* to visualize different data types on web-based, interactive ACSN maps. We illustrate the functionalities of the two packages with biological data taken from large-scale cancer datasets.
dCovTS: Distance Covariance/Correlation for Time Series
The distance covariance function is a new measure of dependence between random vectors. We drop the assumption of iid data to introduce distance covariance for time series. The R package *dCovTS* provides functions that compute and plot distance covariance and correlation functions for both univariate and multivariate time series. Additionally it includes functions for testing serial independence based on distance covariance. This paper describes the theoretical background of distance covariance methodology in time series and discusses in detail the implementation of these methods with the R package *dCovTS*.
comf: An R Package for Thermal Comfort Studies
The field of thermal comfort generated a number of thermal comfort indices. Their code implementation needs to be done by individual researchers. This paper presents the R package, *comf*, which includes functions for common and new thermal comfort indices. Additional functions allow comparisons between the predictive performance of these indices. This paper reviews existing thermal comfort indices and available code implementations. This is followed by the description of the R package and an example how to use the R package for the comparison of different thermal comfort indices on data from a thermal comfort study.
mixtox: An R Package for Mixture Toxicity Assessment
Mixture toxicity assessment is indeed necessary for humans and ecosystems that are continually exposed to a variety of chemical mixtures. This paper describes an R package, called *mixtox*, which offers a general framework of curve fitting, mixture experimental design, and mixture toxicity prediction for practitioners in toxicology. The unique features of *mixtox* include: (1) constructing a uniform table for mixture experimental design; and (2) predicting toxicity of a mixture with multiple components based on reference models such as concentration addition, independent action, and generalized concentration addition. We describe the various functions of the package and provide examples to illustrate their use and show the collaboration of *mixtox* with other existing packages (e.g., *drc*) in predicting toxicity of chemical mixtures.
ggfortify: Unified Interface to Visualize Statistical Results of Popular R Packages
The *ggfortify* package provides a unified interface that enables users to use one line of code to visualize statistical results of many R packages using *ggplot2* idioms. With the help of *ggfortify*, statisticians, data scientists, and researchers can avoid the sometimes repetitive work of using the *ggplot2* syntax to achieve what they need.
QPot: An R Package for Stochastic Differential Equation Quasi-Potential Analysis
QPot (pronounced $ky\overline{\textbf{o}o} + p\ddot{a}t$) is an R package for analyzing two-dimensional systems of stochastic differential equations. It provides users with a wide range of tools to simulate, analyze, and visualize the dynamics of these systems. One of *QPot's* key features is the computation of the quasi-potential, an important tool for studying stochastic systems. Quasi-potentials are particularly useful for comparing the relative stabilities of equilibria in systems with alternative stable states. This paper describes *QPot*'s primary functions, and explains how quasi-potentials can yield insights about the dynamics of stochastic systems. Three worked examples guide users through the application of *QPot*'s functions.
Simulating Correlated Binary and Multinomial Responses under Marginal Model Specification: The SimCorMultRes Package
We developed the R package **SimCorMultRes** to facilitate simulation of correlated categorical (binary and multinomial) responses under a desired marginal model specification. The simulated correlated categorical responses are obtained by applying threshold approaches to correlated continuous responses of underlying regression models and the dependence structure is parametrized in terms of the correlation matrix of the latent continuous responses. This article provides an elaborate introduction to **SimCorMultRes** the package demonstrating its design and usage via three examples. The package can be obtained via CRAN.
eiCompare: Comparing Ecological Inference Estimates across EI and EI:RxC
Social scientists and statisticians often use aggregate data to predict individual-level behavior because the latter are not always available. Various statistical techniques have been developed to make inferences from one level (e.g., precinct) to another level (e.g., individual voter) that minimize errors associated with ecological inference. While ecological inference has been shown to be highly problematic in a wide array of scientific fields, many political scientists and analysis employ the techniques when studying voting patterns. Indeed, federal voting rights lawsuits now require such an analysis, yet expert reports are not consistent in which type of ecological inference is used. This is especially the case in the analysis of racially polarized voting when there are multiple candidates and multiple racial groups. The *eiCompare* package was developed to easily assess two of the more common ecological inference methods: EI and EI:R$\times$C. The package facilitates a seamless comparison between these methods so that scholars and legal practitioners can easily assess the two methods and whether they produce similar or disparate findings.
Two-Tier Latent Class IRT Models in R
In analyzing data deriving from the administration of a questionnaire to a group of individuals, Item Response Theory (IRT) models provide a flexible framework to account for several aspects involved in the response process, such as the existence of multiple latent traits. In this paper, we focus on a class of semi-parametric multidimensional IRT models, in which these traits are represented through one or more discrete latent variables; these models allow us to cluster individuals into homogeneous latent classes and, at the same time, to properly study item characteristics. In particular, we follow a within-item multidimensional formulation similar to that adopted in the two-tier models, with each item measuring one or two latent traits. The proposed class of models may be estimated through the package *MLCIRTwithin*, whose functioning is illustrated in this paper with examples based on data about quality-of-life measurement and about the propensity to commit a crime.
hdm: High-Dimensional Metrics
In this article the package High-dimensional Metrics *hdm* is introduced. It is a collection of statistical methods for estimation and quantification of uncertainty in high-dimensional approximately sparse models. It focuses on providing confidence intervals and significance testing for (possibly many) low-dimensional subcomponents of the high-dimensional parameter vector. Efficient estimators and uniformly valid confidence intervals for regression coefficients on target variables (e.g., treatment or policy variable) in a high-dimensional approximately sparse regression model, for average treatment effect (ATE) and average treatment effect for the treated (ATET), as well for extensions of these parameters to the endogenous setting are provided. Theory grounded, data-driven methods for selecting the penalization parameter in Lasso regressions under heteroscedastic and non-Gaussian errors are implemented. Moreover, joint/ simultaneous confidence intervals for regression coefficients of a high-dimensional sparse regression are implemented. Data sets which have been used in the literature and might be useful for classroom demonstration and for testing new estimators are included.
Subgroup Discovery with Evolutionary Fuzzy Systems in R: The SDEFSR Package
Subgroup discovery is a data mining task halfway between descriptive and predictive data mining. Nowadays it is very relevant for researchers due to the fact that the knowledge extracted is simple and interesting. For this task, evolutionary fuzzy systems are well suited algorithms because they can find a good trade-off between multiple objectives in large search spaces. In fact, this paper presents the SDEFSR package, which contains all the evolutionary fuzzy systems for subgroup discovery presented throughout the literature. It is a package without dependencies on other software, providing functions with recommended default parameters. In addition, it brings a graphical user interface to avoid the user having to know all the parameters of the algorithms.
Distance Measures for Time Series in R: The TSdist Package
The definition of a distance measure between time series is crucial for many time series data mining tasks, such as clustering and classification. For this reason, a vast portfolio of time series distance measures has been published in the past few years. In this paper, the [*TSdist*](https://CRAN.R-project.org/package=TSdist) package is presented, a complete tool which provides a unified framework to calculate the largest variety of time series dissimilarity measures available in R at the moment, to the best of our knowledge. The package implements some popular distance measures which were not previously available in R, and moreover, it also provides wrappers for measures already included in other R packages. Additionally, the application of these distance measures to clustering and classification tasks is also supported in *TSdist*, directly enabling the evaluation and comparison of their performance within these two frameworks.
multipleNCC: Inverse Probability Weighting of Nested Case-Control Data
Reuse of controls from nested case-control designs can increase efficiency in many situations, for instance with competing risks or in other multiple endpoints situations. The matching between cases and controls must be broken when controls are to be used for other endpoints. A weighted analysis can then be performed to take care of the biased sampling from the cohort. We present the R package *multipleNCC* for reuse of controls in nested case-control studies by inverse probability weighting of the partial likelihood. The package handles right-censored, left-truncated and additionally matched data, and varying numbers of sampled controls and the whole analysis is carried out using one simple command. Four weight estimators are presented and variance estimation is explained. The package is illustrated by analyzing health survey data from three counties in Norway for two causes of death: cardiovascular disease and death from alcohol abuse, liver disease, and accidents and violence. The data set is included in the package.
tigris: An R Package to Access and Work with Geographic Data from the US Census Bureau
TIGER/Line shapefiles from the United States Census Bureau are commonly used for the mapping and analysis of US demographic trends. The *tigris* package provides a uniform interface for R users to download and work with these shapefiles. Functions in *tigris* allow R users to request Census geographic datasets using familiar geographic identifiers and return those datasets as objects of class `"Spatial*DataFrame"`. In turn, *tigris* ensures consistent and high-quality spatial data for R users' cartographic and spatial analysis projects that involve US Census data. This article provides an overview of the functionality of the *tigris* package, and concludes with an applied example of a geospatial workflow using data retrieved with *tigris*.
Maps, Coordinate Reference Systems and Visualising Geographic Data with mapmisc
The *mapmisc* package provides functions for visualising geospatial data, including fetching background map layers, producing colour scales and legends, and adding scale bars and orientation arrows to plots. Background maps are returned in the coordinate reference system of the dataset supplied, and inset maps and direction arrows reflect the map projection being plotted. This is a "light weight" package having an emphasis on simplicity and ease of use.
statmod: Probability Calculations for the Inverse Gaussian Distribution
The inverse Gaussian distribution (IGD) is a well known and often used probability distribution for which fully reliable numerical algorithms have not been available. We develop fast, reliable basic probability functions (`dinvgauss`, `pinvgauss`, `qinvgauss` and `rinvgauss`) for the IGD that work for all possible parameter values and which achieve close to full machine accuracy. The most challenging task is to compute quantiles for given cumulative probabilities and we develop a simple but elegant mathematical solution to this problem. We show that Newton's method for finding the quantiles of a IGD always converges monotonically when started from the mode of the distribution. Simple Taylor series expansions are used to improve accuracy on the log-scale. The IGD probability functions provide the same options and obey the same conventions as do probability functions provided in the *stats* package.
Nonparametric Tests for the Interaction in Two-way Factorial Designs Using R
An increasing number of R packages include nonparametric tests for the interaction in two-way factorial designs. This paper briefly describes the different methods of testing and reports the resulting *p*-values of such tests on datasets for four types of designs: between, within, mixed, and pretest-posttest designs. Potential users are advised only to apply tests they are quite familiar with and not be guided by *p*-values for selecting packages and tests.
Gender Prediction Methods Based on First Names with genderizeR
In recent years, there has been increased interest in methods for gender prediction based on first names that employ various open data sources. These methods have applications from bibliometric studies to customizing commercial offers for web users. Analysis of gender disparities in science based on such methods are published in the most prestigious journals, although they could be improved by choosing the most suited prediction method with optimal parameters and performing validation studies using the best data source for a given purpose. There is also a need to monitor and report how well a given prediction method works in comparison to others. In this paper, the author recommends a set of tools (including one dedicated to gender prediction, the R package called *genderizeR*), data sources (including the genderize.io API), and metrics that could be fully reproduced and tested in order to choose the optimal approach suitable for different gender analyses.
sbtools: A Package Connecting R to Cloud-based Data for Collaborative Online Research
The adoption of high-quality tools for collaboration and reproducibile research such as R and Github is becoming more common in many research fields. While Github and other version management systems are excellent resources, they were originally designed to handle code and scale poorly to large text-based or binary datasets. A number of scientific data repositories are coming online and are often focused on dataset archival and publication. To handle collaborative workflows using large scientific datasets, there is increasing need to connect cloud-based online data storage to R. In this article, we describe how the new R package *sbtools* enables direct access to the advanced online data functionality provided by ScienceBase, the U.S. Geological Survey's online scientific data storage platform.
metaplus: An R Package for the Analysis of Robust Meta-Analysis and Meta-Regression
The *metaplus* package is described with examples of its use for fitting meta-analysis and meta-regression. For either meta-analysis or meta-regression it is possible to fit one of three models: standard normal random effect, $t$-distribution random effect or mixture of normal random effects. The latter two models allow for robustness by allowing for a random effect distribution with heavier tails than the normal distribution, and for both robust models the presence of outliers may be tested using the parametric bootstrap. For the mixture of normal random effects model the outlier studies may be identified through their posterior probability of membership in the outlier component of the mixture. Plots allow the results of the different models to be compared. The package is demonstrated on three examples: a meta-analysis with no outliers, a meta-analysis with an outlier and a meta-regression with an outlier.
Spatio-Temporal Interpolation using gstat
We present new spatio-temporal geostatistical modelling and interpolation capabilities of the R package *gstat*. Various spatio-temporal covariance models have been implemented, such as the separable, product-sum, metric and sum-metric models. In a real-world application we compare spatio-temporal interpolations using these models with a purely spatial kriging approach. The target variable of the application is the daily mean $\rm{PM}_{10}$ concentration measured at rural air quality monitoring stations across Germany in 2005. R code for variogram fitting and interpolation is presented in this paper to illustrate the workflow of spatio-temporal interpolation using *gstat*. We conclude that the system works properly and that the extension of *gstat* facilitates and eases spatio-temporal geostatistical modelling and prediction for R users.
Crowdsourced Data Preprocessing with R and Amazon Mechanical Turk
This article introduces the use of the Amazon Mechanical Turk (MTurk) crowdsourcing platform as a resource for R users to leverage crowdsourced human intelligence for preprocessing "messy" data into a form easily analyzed within R. The article first describes MTurk and the *MTurkR* package, then outlines how to use *MTurkR* to gather and manage crowdsourced data with MTurk using some of the package's core functionality. Potential applications of *MTurkR* include construction of manually coded training sets, human transcription and translation, manual data scraping from scanned documents, content analysis, image classification, and the completion of online survey questionnaires, among others. As an example of massive data preprocessing, the article describes an image rating task involving 225 crowdsourced workers and more than 5500 images using just three *MTurkR* function calls.
mclust 5: Clustering, Classification and Density Estimation Using Gaussian Finite Mixture Models
Finite mixture models are being used increasingly to model a wide variety of random phenomena for clustering, classification and density estimation. *mclust* is a powerful and popular package which allows modelling of data as a Gaussian finite mixture with different covariance structures and different numbers of mixture components, for a variety of purposes of analysis. Recently, version 5 of the package has been made available on CRAN. This updated version adds new covariance structures, dimension reduction capabilities for visualisation, model selection criteria, initialisation strategies for the EM algorithm, and bootstrap-based inference, making it a full-featured R package for data analysis via finite mixture modelling.
R Packages to Aid in Handling Web Access Logs
Web access logs contain information on HTTP(S) requests and form a key part of both industry and academic explorations of human behaviour on the internet. But the preparation (reading, parsing and manipulation) of that data is just unique enough to make generalized tools unfit for the task, both in programming time and processing time which are compounded when dealing with large data sets common with web access logs. In this paper we explain and demonstrate a series of packages designed to efficiently read in, parse and munge access log data, allowing researchers to handle URLs and IP addresses easily. These packages are substantially faster than existing R methods - from a 3-500% speedup for file reading to a 57,000% speedup in URL parsing.
GMDH: An R Package for Short Term Forecasting via GMDH-Type Neural Network Algorithms
Group Method of Data Handling (GMDH)-type neural network algorithms are the heuristic self organization method for the modelling of complex systems. GMDH algorithms are utilized for a variety of purposes, examples include identification of physical laws, the extrapolation of physical fields, pattern recognition, clustering, the approximation of multidimensional processes, forecasting without models, etc. In this study, the R package *GMDH* is presented to make short term forecasting through GMDH-type neural network algorithms. The *GMDH* package has options to use different transfer functions (sigmoid, radial basis, polynomial, and tangent functions) simultaneously or separately. Data on cancer death rate of Pennsylvania from 1930 to 2000 are used to illustrate the features of the *GMDH* package. The results based on ARIMA models and exponential smoothing methods are included for comparison.
keyplayer: An R Package for Locating Key Players in Social Networks
Interest in social network analysis has exploded in the past few years, partly thanks to the advancements in statistical methods and computing for network analysis. A wide range of the methods for network analysis is already covered by existent R packages. However, no comprehensive packages are available to calculate group centrality scores and to identify key players (i.e., those players who constitute the most central group) in a network. These functionalities are important because, for example, many social and health interventions rely on key players to facilitate the intervention. Identifying key players is challenging because players who are individually the most central are not necessarily the most central as a group due to redundancy in their connections. In this paper we develop methods and tools for computing group centrality scores and for identifying key players in social networks. We illustrate the methods using both simulated and empirical examples. The package *keyplayer* providing the presented methods is available from Comprehensive R Archive Network (CRAN).
clustering.sc.dp: Optimal Clustering with Sequential Constraint by Using Dynamic Programming
The general clustering algorithms do not guarantee optimality because of the hardness of the problem. Polynomial-time methods can find the clustering corresponding to the exact optimum only in special cases. For example, the dynamic programming algorithm can solve the one-dimensional clustering problem, i.e., when the items to be clustered can be characterised by only one scalar number. Optimal one-dimensional clustering is provided by package *Ckmeans.1d.dp* in R. The paper shows a possible generalisation of the method implemented in this package to multidimensional data: the dynamic programming method can be applied to find the optimum clustering of vectors when only subsequent items may form a cluster. Sequential data are common in various fields including telecommunication, bioinformatics, marketing, transportation etc. The proposed algorithm can determine the optima for a range of cluster numbers in order to support the case when the number of clusters is not known in advance.
progenyClust: an R package for Progeny Clustering
Identifying the optimal number of clusters is a common problem faced by data scientists in various research fields and industry applications. Though many clustering evaluation techniques have been developed to solve this problem, the recently developed algorithm Progeny Clustering is a much faster alternative and one that is relevant to biomedical applications. In this paper, we introduce an R package *progenyClust* that implements and extends the original Progeny Clustering algorithm for evaluating clustering stability and identifying the optimal cluster number. We illustrate its applicability using two examples: a simulated test dataset for proof-of-concept, and a cell imaging dataset for demonstrating its application potential in biomedical research. The *progenyClust* package is versatile in that it offers great flexibility for picking methods and tuning parameters. In addition, the default parameter setting as well as the plot and summary methods offered in the package make the application of Progeny Clustering straightforward and coherent.
Using DECIPHER v2.0 to Analyze Big Biological Sequence Data in R
In recent years, the cost of DNA sequencing has decreased at a rate that has outpaced improvements in memory capacity. It is now common to collect or have access to many gigabytes of biological sequences. This has created an urgent need for approaches that analyze sequences in subsets without requiring all of the sequences to be loaded into memory at one time. It has also opened opportunities to improve the organization and accessibility of information acquired in sequencing projects. The *DECIPHER* package offers solutions to these problems by assisting in the curation of large sets of biological sequences stored in compressed format inside a database. This approach has many practical advantages over standard bioinformatics workflows, and enables large analyses that would otherwise be prohibitively time consuming.
FWDselect: An R Package for Variable Selection in Regression Models
In multiple regression models, when there are a large number ($p$) of explanatory variables which may or may not be relevant for predicting the response, it is useful to be able to reduce the model. To this end, it is necessary to determine the best subset of $q$ ($q\le p$) predictors which will establish the model with the best prediction capacity. *FWDselect* package introduces a new forward stepwise-based selection procedure to select the best model in different regression frameworks (parametric or nonparametric). The developed methodology, which can be equally applied to linear models, generalized linear models or generalized additive models, aims to introduce solutions to the following two topics: i) selection of the best combination of $q$ variables by using a step-by-step method; and, perhaps, most importantly, ii) search for the number of covariates to be included in the model based on bootstrap resampling techniques. The software is illustrated using real and simulated data.
Conditional Fractional Gaussian Fields with the Package FieldSim
We propose an effective and fast method to simulate multidimensional [conditional fractional Gaussian fields]{style="color: black"} with the package *FieldSim*. Our method is valid not only for [conditional simulations]{style="color: black"} associated to fractional Brownian fields, but to any Gaussian field and on any (non regular) grid of points.
Variable Clustering in High-Dimensional Linear Regression: The R Package clere
Dimension reduction is one of the biggest challenges in high-dimensional regression models. We recently introduced a new methodology based on variable clustering as a means to reduce dimensionality. We present here the R package *clere* that implements some refinements of this methodology. An overview of the package functionalities as well as examples to run an analysis are described. Numerical experiments on real data were performed to illustrate the good predictive performance of our parsimonious method compared to standard dimension reduction approaches.
Exploring Interaction Effects in Two-Factor Studies using the hiddenf Package in R.
In crossed, two-factor studies with one observation per factor-level combination, interaction effects between factors can be hard to detect and can make the choice of a suitable statistical model difficult. This article describes *hiddenf*, an R package that enables users to quantify and characterize a certain form of interaction in two-factor layouts. When effects of one factor (a) fall into two groups depending on the level of another factor, and (b) are constant within these groups, the interaction pattern is deemed \"hidden additivity\" because within groups, the effects of the two factors are additive, while between groups the factors are allowed to interact. The *hiddenf* software can be used to estimate, test, and report an appropriate factorial effects model corresponding to hidden additivity, which is intermediate between the unavailable full factorial model and the overly-simplistic additive model. Further, the software also conducts five statistical tests for interaction proposed between 1949 and 2014. A collection of 17 datasets is used for illustration.
Model Builder for Item Factor Analysis with OpenMx
We introduce a shiny web application to facilitate the construction of Item Factor Analysis (a.k.a. Item Response Theory) models using the *OpenMx* package. The web application assists with importing data, outcome recoding, and model specification. However, the app does not conduct any analysis but, rather, generates an analysis script. Generated Rmarkdown output serves dual purposes: to analyze a data set and demonstrate good programming practices. The app can be used as a teaching tool or as a starting point for custom analysis scripts.
SWMPr: An R Package for Retrieving, Organizing, and Analyzing Environmental Data for Estuaries
The System-Wide Monitoring Program (SWMP) was implemented in 1995 by the US National Estuarine Research Reserve System. This program has provided two decades of continuous monitoring data at over 140 fixed stations in 28 estuaries. However, the increasing quantity of data provided by the monitoring network has complicated broad-scale comparisons between systems and, in some cases, prevented simple trend analysis of water quality parameters at individual sites. This article describes the *SWMPr* package that provides several functions that facilitate data retrieval, organization, and analysis of time series data in the reserve estuaries. Previously unavailable functions for estuaries are also provided to estimate rates of ecosystem metabolism using the open-water method. The *SWMPr* package has facilitated a cross-reserve comparison of water quality trends and links quantitative information with analysis tools that have use for more generic applications to environmental time series.
CryptRndTest: An R Package for Testing the Cryptographic Randomness
In this article, we introduce the R package *CryptRndTest* that performs eight statistical randomness tests on cryptographic random number sequences. The purpose of the package is to provide software implementing recently proposed cryptographic randomness tests utilizing goodness-of-fit tests superior to the usual chi-square test in terms of statistical performance. Most of the tests included in package *CryptRndTest* are not available in other software packages such as the R package *RDieHarder* or the C library TestU01. Chi-square, Anderson-Darling, Kolmogorov-Smirnov, and Jarque-Bera goodness-of-fit procedures are provided along with cryptographic randomness tests. *CryptRndTest* utilizes multiple precision floating numbers for sequences longer than 64-bit based on the package *Rmpfr*. By this way, included tests are applied precisely for higher bit-lengths. In addition *CryptRndTest* provides a user friendly interface to these cryptographic randomness tests. As an illustrative application, *CryptRndTest* is used to test available random number generators in R.
SchemaOnRead: A Package for Schema-on-Read in R
SchemaOnRead is a CRAN package that provides an extensible mechanism for importing a wide range of file types into R as well as support for the emerging schema-on-read paradigm in R. The schema-on-read tools within the package include a single function call that recursively reads folders with text, comma separated value, raster image, R data, HDF5, NetCDF, spreadsheet, Weka, Epi Info, Pajek network, R network, HTML, SPSS, Systat, and Stata files. It also recursively reads folders (e.g., schemaOnRead(folder)), returning a nested list of the contained elements. The provided tools can be used as-is or easily customized to implement tool chains in R. This paper's contribution is that it introduces and describes the *SchemaOnRead* package and compares it to related R packages.
rTableICC: An R Package for Random Generation of 2x2xK and RxC Contingency Tables
In this paper, we describe the R package *rTableICC* that provides an interface for random generation of 2$\times$`<!-- -->`{=html}2$\times$K and R$\times$C contingency tables constructed over either intraclass-correlated or uncorrelated individuals. Intraclass correlations arise in studies where sampling units include more than one individual and these individuals are correlated. The package implements random generation of contingency tables over individuals with or without intraclass correlations under various sampling plans. The package include two functions for the generation of K 2$\times$`<!-- -->`{=html}2 tables over product-multinomial sampling schemes and that of 2$\times$`<!-- -->`{=html}2$\times$K tables under Poisson or multinomial sampling plans. It also contains two functions that generate R$\times$C tables under product-multinomial, multinomial or Poisson sampling plans with or without intraclass correlations. The package also includes a function for random number generation from a given probability distribution. In addition to the contingency table format, the package also provides raw data required for further estimation purposes.
Stylometry with R: A Package for Computational Text Analysis
This software paper describes 'Stylometry with R' (*stylo*), a flexible R package for the high-level analysis of writing style in stylometry. Stylometry (computational stylistics) is concerned with the quantitative study of writing style, e.g. authorship verification, an application which has considerable potential in forensic contexts, as well as historical research. In this paper we introduce the possibilities of *stylo* for computational text analysis, via a number of dummy case studies from English and French literature. We demonstrate how the package is particularly useful in the exploratory statistical analysis of texts, e.g. with respect to authorial writing style. Because *stylo* provides an attractive graphical user interface for high-level exploratory analyses, it is especially suited for an audience of novices, without programming skills (e.g. from the Digital Humanities). More experienced users can benefit from our implementation of a series of standard pipelines for text processing, as well as a number of similarity metrics.
Generalized Hermite Distribution Modelling with the R Package hermite
The Generalized Hermite distribution (and the Hermite distribution as a particular case) is often used for fitting count data in the presence of overdispersion or multimodality. Despite this, to our knowledge, no standard software packages have implemented specific functions to compute basic probabilities and make simple statistical inference based on these distributions. We present here a set of computational tools that allows the user to face these difficulties by modelling with the Generalized Hermite distribution using the R package *hermite*. The package can also be used to generate random deviates from a Generalized Hermite distribution and to use basic functions to compute probabilities (density, cumulative density and quantile functions are available), to estimate parameters using the maximum likelihood method and to perform the likelihood ratio test for Poisson assumption against a Generalized Hermite alternative. In order to improve the density and quantile functions performance when the parameters are large, Edgeworth and Cornish-Fisher expansions have been used. Hermite regression is also a useful tool for modeling inflated count data, so its inclusion to a commonly used software like R will make this tool available to a wide range of potential users. Some examples of usage in several fields of application are also given.
Open-Channel Computation with R
The *rivr* package provides a computational toolset for simulating steady and unsteady one-dimensional flows in open channels. It is designed primarily for use by instructors of undergraduate- and graduate-level open-channel hydrodynamics courses in such diverse fields as river engineering, physical geography and geophysics. The governing equations used to describe open-channel flows are briefly presented, followed by example applications. These include the computation of gradually-varied flows and two examples of unsteady flows in channels---namely, the tracking of the evolution of a flood wave in a channel and the prediction of extreme variation in the water-surface profile that results when a sluice gate is abruptly closed. Model results for the unsteady flow examples are validated against standard benchmarks. The article concludes with a discussion of potential modifications and extensions to the package.
scmamp: Statistical Comparison of Multiple Algorithms in Multiple Problems
Comparing the results obtained by two or more algorithms in a set of problems is a central task in areas such as machine learning or optimization. Drawing conclusions from these comparisons may require the use of statistical tools such as hypothesis testing. There are some interesting papers that cover this topic. In this manuscript we present *scmamp*, an R package aimed at being a tool that simplifies the whole process of analyzing the results obtained when comparing algorithms, from loading the data to the production of plots and tables.
Numerical Evaluation of the Gauss Hypergeometric Function with the hypergeo Package
This paper introduces the *hypergeo* package of R routines for numerical calculation of hypergeometric functions. The package is focussed on efficient and accurate evaluation of the Gauss hypergeometric function over the whole of the complex plane within the constraints of fixed-precision arithmetic. The hypergeometric series is convergent only within the unit circle, so analytic continuation must be used to define the function outside the unit circle. This short document outlines the numerical and conceptual methods used in the package; and justifies the package philosophy, which is to maintain transparent and verifiable links between the software and @abramowitz1965. Most of the package functionality is accessed via the single function `hypergeo()`, which dispatches to one of several methods depending on the value of its arguments. The package is demonstrated in the context of game theory.
Code Profiling in R: A Review of Existing Methods and an Introduction to Package GUIProfiler
Code analysis tools are crucial to understand program behavior. Profile tools use the results of time measurements in the execution of a program to gain this understanding and thus help in the optimization of the code. In this paper, we review the different available packages to profile R code and show the advantages and disadvantages of each of them. In additon, we present *GUIProfiler*, a package that fulfills some unmet needs.\ Package *GUIProfiler* generates an HTML report with the timing for each code line and the relationships between different functions. This package mimics the behavior of the MATLAB profiler. The HTML report includes information on the time spent on each of the lines of the profiled code (the slowest code is highlighted). If the package is used within the RStudio environment, the user can navigate across the bottlenecks in the code and open the editor to modify the lines of code where more time is spent. It is also possible to edit the code using Notepad++ (a free editor for Windows) by simply clicking on the corresponding line. The graphical user interface makes it easy to identify the specific lines which slow down the code.\ The integration in RStudio and the generation of an HTML report makes *GUIProfiler* a very convenient tool to perform code optimization.
An R Package for the Panel Approach Method for Program Evaluation: pampe
The *pampe* package for R implements the panel data approach method for program evaluation designed to estimate the causal effects of political interventions or treatments. This procedure exploits the dependence among cross-sectional units to construct a counterfactual of the treated unit(s), and it is an appropriate method for research events that occur at an aggregate level like countries or regions and that affect only one or a small number of units. The implementation of the *pampe* package is illustrated using data from Hong Kong and 24 other units, by examining the economic impact of the political and economic integration of Hong Kong with mainland China in 1997 and 2004 respectively.
VSURF: An R Package for Variable Selection Using Random Forests
This paper describes the R package *VSURF*. Based on random forests, and for both regression and classification problems, it returns two subsets of variables. The first is a subset of important variables including some redundancy which can be relevant for interpretation, and the second one is a smaller subset corresponding to a model trying to avoid redundancy focusing more closely on the prediction objective. The two-stage strategy is based on a preliminary ranking of the explanatory variables using the random forests permutation-based score of importance and proceeds using a stepwise forward strategy for variable introduction. The two proposals can be obtained automatically using data-driven default values, good enough to provide interesting results, but strategy can also be tuned by the user. The algorithm is illustrated on a simulated example and its applications to real datasets are presented.
quickpsy: An R Package to Fit Psychometric Functions for Multiple Groups
*quickpsy* is a package to parametrically fit psychometric functions. In comparison with previous R packages, *quickpsy* was built to easily fit and plot data for multiple groups. Here, we describe the standard parametric model used to fit psychometric functions and the standard estimation of its parameters using maximum likelihood. We also provide examples of usage of *quickpsy*, including how allowing the lapse rate to vary can sometimes eliminate the bias in parameter estimation, but not in general. Finally, we describe some implementation details, such as how to avoid the problems associated to round-off errors in the maximisation of the likelihood or the use of closures and non-standard evaluation functions.
An Interactive Survey Application for Validating Social Network Analysis Techniques
Social network analysis is extremely well supported by the R community and is routinely used for studying the relationships between people engaged in collaborative activities. While there has been rapid development of new approaches and metrics in this field, the challenging question of validity (how well insights derived from social networks agree with reality) is often difficult to address. We propose the use of several R packages to generate interactive surveys that are specifically well suited for validating social network analyses. Using our web-based survey application, we were able to validate the results of applying community-detection algorithms to infer the organizational structure of software developers contributing to open-source projects.
QuantifQuantile: An R Package for Performing Quantile Regression through Optimal Quantization
In quantile regression, various quantiles of a response variable $Y$ are modelled as functions of covariates (rather than its mean). An important application is the construction of reference curves/surfaces and conditional prediction intervals for $Y$. Recently, a nonparametric quantile regression method based on the concept of optimal quantization was proposed. This method competes very well with $k$-nearest neighbor, kernel, and spline methods. In this paper, we describe an R package, called *QuantifQuantile*, that allows to perform quantization-based quantile regression. We describe the various functions of the package and provide examples.
ClustVarLV: An R Package for the Clustering of Variables Around Latent Variables
The clustering of variables is a strategy for deciphering the underlying structure of a data set. Adopting an exploratory data analysis point of view, the Clustering of Variables around Latent Variables (CLV) approach has been proposed by @{Vigneau(2003)}. Based on a family of optimization criteria, the CLV approach is adaptable to many situations. In particular, constraints may be introduced in order to take account of additional information about the observations and/or the variables. In this paper, the CLV method is depicted and the R package *ClustVarLV* including a set of functions developed so far within this framework is introduced. Considering successively different types of situations, the underlying CLV criteria are detailed and the various functions of the package are illustrated using real case studies.
Heteroscedastic Censored and Truncated Regression with crch
The *crch* package provides functions for maximum likelihood estimation of censored or truncated regression models with conditional heteroscedasticity along with suitable standard methods to summarize the fitted models and compute predictions, residuals, etc. The supported distributions include left- or right-censored or truncated Gaussian, logistic, or student-t distributions with potentially different sets of regressors for modeling the conditional location and scale. The models and their R implementation are introduced and illustrated by numerical weather prediction tasks using precipitation data for Innsbruck (Austria).
mtk: A General-Purpose and Extensible R Environment for Uncertainty and Sensitivity Analyses of Numerical Experiments
Along with increased complexity of the models used for scientific activities and engineering come diverse and greater uncertainties. Today, effectively quantifying the uncertainties contained in a model appears to be more important than ever. Scientific fellows know how serious it is to calibrate their model in a robust way, and decision-makers describe how critical it is to keep the best effort to reduce the uncertainties about the model. Effectively accessing the uncertainties about the model requires mastering all the tasks involved in the numerical experiments, from optimizing the experimental design to managing the very time consuming aspect of model simulation and choosing the adequate indicators and analysis methods.\ In this paper, we present an open framework for organizing the complexity associated with numerical model simulation and analyses. Named *mtk* (Mexico Toolkit), the developed system aims at providing practitioners from different disciplines with a systematic and easy way to compare and to find the best method to effectively uncover and quantify the uncertainties contained in the model and further to evaluate their impact on the performance of the model. Such requirements imply that the system must be generic, universal, homogeneous, and extensible. This paper discusses such an implementation using the R scientific computing platform and demonstrates its functionalities with examples from agricultural modeling.\ The package *mtk* is of general purpose and easy to extend. Numerous methods are already available in the actual release version, including Fast, Sobol, Morris, Basic Monte-Carlo, Regression, LHS (Latin Hypercube Sampling), PLMM (Polynomial Linear metamodel). Most of them are compiled from available R packages with extension tools delivered by package *mtk*.
ALTopt: An R Package for Optimal Experimental Design of Accelerated Life Testing
The R package *ALTopt* has been developed with the aim of creating and evaluating optimal experimental designs of censored accelerated life tests (ALTs). This package takes the generalized linear model approach to ALT planning, because this approach can easily handle censoring plans and derive information matrices for evaluating designs. Three types of optimality criteria are considered: *D*-optimality for model parameter estimation, *U*-optimality for reliability prediction at a single use condition, and *I*-optimality for reliability prediction over a region of use conditions. The Weibull distribution is assumed for failure time data and more than one stress factor can be specified in the package. Several graphical evaluation tools are also provided for the comparison of different ALT test plans.
mmpp: A Package for Calculating Similarity and Distance Metrics for Simple and Marked Temporal Point Processes
A simple temporal point process (SPP) is an important class of time series, where the sample realization of the process is solely composed of the times at which events occur. Particular examples of point process data are neuronal spike patterns or spike trains, and a large number of distance and similarity metrics for those data have been proposed. A marked point process (MPP) is an extension of a simple temporal point process, in which a certain vector valued mark is associated with each of the temporal points in the SPP. Analyses of MPPs are of practical importance because instances of MPPs include recordings of natural disasters such as earthquakes and tornadoes. In this paper, we introduce the R package *mmpp*, which implements a number of distance and similarity metrics for SPPs, and also extends those metrics for dealing with MPPs.
Working with Multilabel Datasets in R: The mldr Package
Most classification algorithms deal with datasets which have a set of input features, the variables to be used as predictors, and only one output class, the variable to be predicted. However, in late years many scenarios in which the classifier has to work with several outputs have come to life. Automatic labeling of text documents, image annotation or protein classification are among them. Multilabel datasets are the product of these new needs, and they have many specific traits. The *mldr* package allows the user to load datasets of this kind, obtain their characteristics, produce specialized plots, and manipulate them. The goal is to provide the exploratory tools needed to analyze multilabel datasets, as well as the transformation and manipulation functions that will make possible to apply binary and multiclass classification models to this data or the development of new multilabel classifiers. Thanks to its integrated user interface, the exploratory functions will be available even to non-specialized R users.
treeClust: An R Package for Tree-Based Clustering Dissimilarities
This paper describes *treeClust*, an R package that produces dissimilarities useful for clustering. These dissimilarities arise from a set of classification or regression trees, one with each variable in the data acting in turn as a the response, and all others as predictors. This use of trees produces dissimilarities that are insensitive to scaling, benefit from automatic variable selection, and appear to perform well. The software allows a number of options to be set, affecting the set of objects returned in the call; the user can also specify a clustering algorithm and, optionally, return only the clustering vector. The package can also generate a numeric data set whose inter-point distances relate to the *treeClust* ones; such a numeric data set can be much smaller than the vector of inter-point dissimilarities, a useful feature in big data sets.
Fitting Conditional and Simultaneous Autoregressive Spatial Models in hglm
We present a new version ($\geqslant 2.0$) of the *hglm* package for fitting hierarchical generalized linear models (HGLMs) with spatially correlated random effects. `CAR()` and `SAR()` families for conditional and simultaneous autoregressive random effects were implemented. Eigen decomposition of the matrix describing the spatial structure (e.g., the neighborhood matrix) was used to transform the CAR/SAR random effects into an independent, but heteroscedastic, Gaussian random effect. A linear predictor is fitted for the random effect variance to estimate the parameters in the CAR and SAR models. This gives a computationally efficient algorithm for moderately sized problems.
apc: An R Package for Age-Period-Cohort Analysis
The *apc* package includes functions for age-period-cohort analysis based on the canonical parametrisation of @KuangNielsenNielsen2008a. The package includes functions for organizing the data, descriptive plots, a deviance table, estimation of (sub-models of) the age-period-cohort model, a plot for specification testing, plots of estimated parameters, and sub-sample analysis.
BSGS: Bayesian Sparse Group Selection
An R package *BSGS* is provided for the integration of Bayesian variable and sparse group selection separately proposed by @Chen:2011 and @Chen:2014 for variable selection problems, even in the cases of large $p$ and small $n$. This package is designed for variable selection problems including the identification of the important groups of variables and the active variables within the important groups. This article introduces the functions in the *BSGS* package that can be used to perform sparse group selection as well as variable selection through simulation studies and real data.
SRCS: Statistical Ranking Color Scheme for Visualizing Parameterized Multiple Pairwise Comparisons with R
The problem of comparing a new solution method against existing ones to find statistically significant differences arises very often in sciences and engineering. When the problem instance being solved is defined by several parameters, assessing a number of methods with respect to many problem configurations simultaneously becomes a hard task. Some visualization technique is required for presenting a large number of statistical significance results in an easily interpretable way. Here we review an existing color-based approach called Statistical Ranking Color Scheme (SRCS) for displaying the results of multiple pairwise statistical comparisons between several methods assessed separately on a number of problem configurations. We introduce an R package implementing SRCS, which performs all the pairwise statistical tests from user data and generates customizable plots. We demonstrate its applicability on two examples from the areas of dynamic optimization and machine learning, in which several algorithms are compared on many problem instances, each defined by a combination of parameters.
abctools: An R Package for Tuning Approximate Bayesian Computation Analyses
Approximate Bayesian computation (ABC) is a popular family of algorithms which perform approximate parameter inference when numerical evaluation of the likelihood function is not possible but data can be simulated from the model. They return a sample of parameter values which produce simulations close to the observed dataset. A standard approach is to reduce the simulated and observed datasets to vectors of *summary statistics* and accept when the difference between these is below a specified threshold. ABC can also be adapted to perform model choice.\ In this article, we present a new software package for R, *abctools* which provides methods for tuning ABC algorithms. This includes recent dimension reduction algorithms to tune the choice of summary statistics, and coverage methods to tune the choice of threshold. We provide several illustrations of these routines on applications taken from the ABC literature.
zoib: An R Package for Bayesian Inference for Beta Regression and Zero/One Inflated Beta Regression
The beta distribution is a versatile function that accommodates a broad range of probability distribution shapes. Beta regression based on the beta distribution can be used to model a response variable $y$ that takes values in open unit interval $(0, 1)$. Zero/one inflated beta (ZOIB) regression models can be applied when $y$ takes values from closed unit interval $[0,1]$. The ZOIB model is based a piecewise distribution that accounts for the probability mass at 0 and 1, in addition to the probability density within $(0, 1)$. This paper introduces an R package -- *zoib* that provides Bayesian inferences for a class of ZOIB models. The statistical methodology underlying the *zoib* package is discussed, the functions covered by the package are outlined, and the usage of the package is illustrated with three examples of different data and model types. The package is comprehensive and versatile in that it can model data with or without inflation at 0 or 1, accommodate clustered and correlated data via latent variables, perform penalized regression as needed, and allow for model comparison via the computation of the DIC criterion.
PracTools: Computations for Design of Finite Population Samples
PracTools is an R package with functions that compute sample sizes for various types of finite population sampling designs when totals or means are estimated. One-, two-, and three-stage designs are covered as well as allocations for stratified sampling and probability proportional to size sampling. Sample allocations can be computed that minimize the variance of an estimator subject to a budget constraint or that minimize cost subject to a precision constraint. The package also contains some specialized functions for estimating variance components and design effects. Several finite populations are included that are useful for classroom instruction.
R as an Environment for Reproducible Analysis of DNA Amplification Experiments
There is an ever-increasing number of applications, which use quantitative PCR (qPCR) or digital PCR (dPCR) to elicit fundamentals of biological processes. Moreover, quantitative isothermal amplification (qIA) methods have become more prominent in life sciences and point-of-care-diagnostics. Additionally, the analysis of melting data is essential during many experiments. Several software packages have been developed for the analysis of such datasets. In most cases, the software is either distributed as closed source software or as monolithic block with little freedom to perform highly customized analysis procedures. We argue, among others, that R is an excellent foundation for reproducible and transparent data analysis in a highly customizable cross-platform environment. However, for novices it is often challenging to master R or learn capabilities of the vast number of packages available. In the paper, we describe exemplary workflows for the analysis of qPCR, qIA or dPCR experiments including the analysis of melting curve data. Our analysis relies entirely on R packages available from public repositories. Additionally, we provide information related to standardized and reproducible research.
Implementing Persistent O(1) Stacks and Queues in R
True to their functional roots, most R functions are side-effect-free, and users expect datatypes to be persistent. However, these semantics complicate the creation of efficient and dynamic data structures. Here, we describe the implementation of stack and queue data structures satisfying these conditions in R, available in the CRAN package *rstackdeque*. Guided by important work in purely functional languages, we look at both partially- and fully-persistent versions of queues, comparing their performance characteristics. Finally, we illustrate the usefulness of such dynamic structures with examples of generating and solving mazes.
sae: An R Package for Small Area Estimation
We describe the R package *sae* for small area estimation. This package can be used to obtain model-based estimates for small areas based on a variety of models at the area and unit levels, along with basic direct and indirect estimates. Mean squared errors are estimated by analytical approximations in simple models and applying bootstrap procedures in more complex models. We describe the package functions and show how to use them through examples.
Correspondence Analysis on Generalised Aggregated Lexical Tables (CA-GALT) in the FactoMineR Package
Correspondence analysis on generalised aggregated lexical tables (CA-GALT) is a method that generalizes classical CA-ALT to the case of several quantitative, categorical and mixed variables. It aims to establish a typology of the external variables and a typology of the events from their mutual relationships. In order to do so, the influence of external variables on the lexical choices is untangled cancelling the associations among them, and to avoid the instability issued from multicollinearity, they are substituted by their principal components. The `CaGalt` function, implemented in the *FactoMineR* package, provides numerous numerical and graphical outputs. Confidence ellipses are also provided to validate and improve the representation of words and variables. Although this methodology was developed mainly to give an answer to the problem of analyzing open-ended questions, it can be applied to any kind of frequency/contingency table with external variables.
fslr: Connecting the FSL Software with R
We present the package *fslr*, a set of R functions that interface with FSL (FMRIB Software Library), a commonly-used open-source software package for processing and analyzing neuroimaging data. The *fslr* package performs operations on '`nifti`' image objects in R using command-line functions from FSL, and returns R objects back to the user. *fslr* allows users to develop image processing and analysis pipelines based on FSL functionality while interfacing with the functionality provided by R. We present an example of the analysis of structural magnetic resonance images, which demonstrates how R users can leverage the functionality of FSL without switching to shell commands.
sparkTable: Generating Graphical Tables for Websites and Documents with R
Visual analysis of data is important to understand the main characteristics, main trends and relationships in data sets and it can be used to assess the data quality. Using the R package *sparkTable*, statistical tables holding quantitative information can be enhanced by including spark-type graphs such as sparklines {width="1.2cm" height="1em"} and sparkbars {width="1.2cm" height="1em"}.\ These kind of graphics are well-known in literature and are considered as simple, intense and illustrative graphs that are small enough to fit in a single line. Thus, they can easily enrich tables and texts with additional information in a comprehensive visual way.\ The R package *sparkTable* uses a clean S4 class design and provides methods to create different types of sparkgraphs that can be used in websites, presentations and documents. We also implemented an easy way for non-experts to create highly complex tables. In this case, graphical parameters can be interactively changed, variables can be sorted, graphs can be added and removed in an interactive manner. Thereby it is possible to produce custom-tailored graphical tables -- standard tables that are enriched with graphs -- that can be displayed in a browser and exported to various formats.
showtext: Using System Fonts in R Graphics
This article introduces the *showtext* package that makes it easy to use system fonts in R graphics. Unlike other methods to embed fonts into graphics, *showtext* converts text into raster images or polygons, and then adds them to the plot canvas. This method produces platform-independent image files that do not rely on the fonts that create them. It supports a large number of font formats and R graphics devices, and meanwhile provides convenient features such as using web fonts and integrating with *knitr*. This article provides an elaborate introduction to the *showtext* package, including its design, usage, and examples.
Estimability Tools for Package Developers
When a linear model is rank-deficient, then predictions based on that model become questionable because not all predictions are uniquely estimable. However, some of them are, and the *estimability* package provides tools that package developers can use to tell which is which. With the use of these tools, a model object's `predict` method could return estimable predictions as-is while flagging non-estimable ones in some way, so that the user can know which predictions to believe. The *estimability* package also provides, as a demonstration, an estimability-enhanced `epredict` method to use in place of `predict` for models fitted using the *stats* package.
Manipulation of Discrete Random Variables with discreteRV
A prominent issue in statistics education is the sometimes large disparity between the theoretical and the computational coursework. *discreteRV* is an R package for manipulation of discrete random variables which uses clean and familiar syntax similar to the mathematical notation in introductory probability courses. The package offers functions that are simple enough for users with little experience with statistical programming, but has more advanced features which are suitable for a large number of more complex applications. In this paper, we introduce and motivate *discreteRV*, describe its functionality, and provide reproducible examples illustrating its use.
rdrobust: An R Package for Robust Nonparametric Inference in Regression-Discontinuity Designs
This article describes the R package *rdrobust*, which provides data-driven graphical and inference procedures for RD designs. The package includes three main functions: `rdrobust`, `rdbwselect` and `rdplot`. The first function (`rdrobust`) implements conventional local-polynomial RD treatment effect point estimators and confidence intervals, as well as robust bias-corrected confidence intervals, for average treatment effects at the cutoff. This function covers sharp RD, sharp kink RD, fuzzy RD and fuzzy kink RD designs, among other possibilities. The second function (`rdbwselect`) implements several bandwidth selectors proposed in the RD literature. The third function (`rdplot`) provides data-driven optimal choices of evenly-spaced and quantile-spaced partition sizes, which are used to implement several data-driven RD plots.
Frames2: A Package for Estimation in Dual Frame Surveys
Data from complex survey designs require special consideration with regard to estimation of finite population parameters and corresponding variance estimation procedures, as a consequence of significant departures from the simple random sampling assumption. In the past decade a number of statistical software packages have been developed to facilitate the analysis of complex survey data. All these statistical software packages are able to treat samples selected from one sampling frame containing all population units. Dual frame surveys are very useful when it is not possible to guarantee a complete coverage of the target population and may result in considerable cost savings over a single frame design with comparable precision. There are several estimators available in the statistical literature but no existing software covers dual frame estimation procedures. This gap is now filled by package *Frames2*. In this paper we highlight the main features of the package. The package includes the main estimators in dual frame surveys and also provides interval confidence estimation.
The Complex Multivariate Gaussian Distribution
Here I introduce package *cmvnorm*, a complex generalization of the *mvtnorm* package. A complex generalization of the Gaussian process is suggested and numerical results presented using the package. An application in the context of approximating the Weierstrass $\sigma$-function using a complex Gaussian process is given.
The gridGraphics Package
The *gridGraphics* package provides a function, `grid.echo()`, that can be used to convert a plot drawn with the *graphics* package to a visually identical plot drawn using *grid*. This conversion provides access to a variety of *grid* tools for making customisations and additions to the plot that are not possible with the *graphics* package.
fanplot: An R Package for Visualising Sequential Distributions
Fan charts, first developed by the Bank of England in 1996, have become a standard method for visualising forecasts with uncertainty. Using shading fan charts focus the attention towards the whole distribution away from a single central measure. This article describes the basics of plotting fan charts using an R add-on package alongside some additional methods for displaying sequential distributions. Examples are based on distributions of both estimated parameters from a time series model and future values with uncertainty.
Identifying Complex Causal Dependencies in Configurational Data with Coincidence Analysis
We present cna, a package for performing Coincidence Analysis (CNA). CNA is a configurational comparative method for the identification of complex causal dependencies---in particular, causal chains and common cause structures---in configurational data. After a brief introduction to the method's theoretical background and main algorithmic ideas, we demonstrate the use of the package by means of an artificial and a real-life data set. Moreover, we outline planned enhancements of the package that will further increase its applicability.
Peptides: A Package for Data Mining of Antimicrobial Peptides
Antimicrobial peptides (AMP) are a promising source of antibiotics with a broad spectrum activity against bacteria and low incidence of developing resistance. The mechanism by which an AMP executes its function depends on a set of computable physicochemical properties from the amino acid sequence. The *Peptides* package was designed to allow the quick and easy computation of ten structural characteristics own of the antimicrobial peptides, with the aim of generating data to increase the accuracy in classification and design of new amino acid sequences. Moreover, the options to read and plot XVG output files from GROMACS molecular dynamics package are included.
bshazard: A Flexible Tool for Nonparametric Smoothing of the Hazard Function
The hazard function is a key component in the inferential process in survival analysis and relevant for describing the pattern of failures. However, it is rarely shown in research papers due to the difficulties in nonparametric estimation. We developed the *bshazard* package to facilitate the computation of a nonparametric estimate of the hazard function, with data-driven smoothing. The method accounts for left truncation, right censoring and possible covariates. B-splines are used to estimate the shape of the hazard within the generalized linear mixed models framework. Smoothness is controlled by imposing an autoregressive structure on the baseline hazard coefficients. This perspective allows an 'automatic' smoothing by avoiding the need to choose the smoothing parameter, which is estimated from the data as a dispersion parameter. A simulation study demonstrates the capability of our software and an application to estimate the hazard of Non-Hodgkin's lymphoma in Swedish population data shows its potential.
Farewell's Linear Increments Model for Missing Data: The FLIM Package
Missing data is common in longitudinal studies. We present a package for Farewell's Linear Increments Model for Missing Data (the *FLIM* package), which can be used to fit linear models for observed increments of longitudinal processes and impute missing data. The method is valid for data with regular observation patterns. The end result is a list of fitted models and a hypothetical complete dataset corresponding to the data we might have observed had individuals not been missing. The *FLIM* package may also be applied to longitudinal studies for causal analysis, by considering counterfactual data as missing data - for instance to compare the effect of different treatments when only data from observational studies are available. The aim of this article is to give an introduction to the *FLIM* package and to demonstrate how the package can be applied.
Flexible R Functions for Processing Accelerometer Data, with Emphasis on NHANES 2003--2006
Accelerometers are a valuable tool for measuring physical activity (PA) in epidemiological studies. However, considerable processing is needed to convert time-series accelerometer data into meaningful variables for statistical analysis. This article describes two recently developed R packages for processing accelerometer data. The package *accelerometry* contains functions for performing various data processing procedures, such as identifying periods of non-wear time and bouts of activity. The functions are flexible, computationally efficient, and compatible with uniaxial or triaxial data. The package *nhanesaccel* is specifically for processing data from the National Health and Nutrition Examination Survey (NHANES), years 2003--2006. Its primary function generates measures of PA volume, intensity, frequency, and patterns according to user-specified data processing methods. This function can process the NHANES 2003--2006 dataset in under one minute, which is a drastic improvement over existing software. This article highlights important features of packages *accelerometry* and *nhanesaccel* and demonstrates typical usage for PA researchers.
ngspatial: A Package for Fitting the Centered Autologistic and Sparse Spatial Generalized Linear Mixed Models for Areal Data
Two important recent advances in areal modeling are the centered autologistic model and the sparse spatial generalized linear mixed model (SGLMM), both of which are reparameterizations of traditional models. The reparameterizations improve regression inference by alleviating spatial confounding, and the sparse SGLMM also greatly speeds computing by reducing the dimension of the spatial random effects. Package *ngspatial* ('ng' = non-Gaussian) provides routines for fitting these new models. The package supports composite likelihood and Bayesian inference for the centered autologistic model, and Bayesian inference for the sparse SGLMM.
SMR: An R Package for Computing the Externally Studentized Normal Midrange Distribution
The main purpose of this paper is to present the main algorithms underlining the construction and implementation of the *SMR* package, whose aim is to compute studentized normal midrange distribution. Details on the externally studentized normal midrange and standardized normal midrange distributions are also given. The package follows the same structure as the probability functions implemented in R. That is: the probability density function (`dSMR`), the cumulative distribution function (`pSMR`), the quantile function (`qSMR`) and the random number generating function (`rSMR`). Pseudocode and illustrative examples of how to use the package are presented.
MVN: An R Package for Assessing Multivariate Normality
Assessing the assumption of multivariate normality is required by many parametric multivariate statistical methods, such as MANOVA, linear discriminant analysis, principal component analysis, canonical correlation, etc. It is important to assess multivariate normality in order to proceed with such statistical methods. There are many analytical methods proposed for checking multivariate normality. However, deciding which method to use is a challenging process, since each method may give different results under certain conditions. Hence, we may say that there is no best method, which is valid under any condition, for normality checking. In addition to numerical results, it is very useful to use graphical methods to decide on multivariate normality. Combining the numerical results from several methods with graphical approaches can be useful and provide more reliable decisions. Here, we present an R package, *MVN*, to assess multivariate normality. It contains the three most widely used multivariate normality tests, including Mardia's, Henze-Zirkler's and Royston's, and graphical approaches, including chi-square Q-Q, perspective and contour plots. It also includes two multivariate outlier detection methods, which are based on robust Mahalanobis distances. Moreover, this package offers functions to check the univariate normality of marginal distributions through both tests and plots. Furthermore, especially for non-R users, we provide a user-friendly web application of the package. This application is available at <http://www.biosoft.hacettepe.edu.tr/MVN/>.
qmethod: A Package to Explore Human Perspectives Using Q Methodology
Q is a methodology to explore the distinct subjective perspectives that exist within a group. It is used increasingly across disciplines. The methodology is semi-qualitative and the data are analysed using data reduction methods to discern the existing patterns of thought. This package is the first to perform Q analysis in R, and it provides many advantages to the existing software: namely, it is fully cross-platform, the algorithms can be transparently examined, it provides results in a clearly structured and tabulated form ready for further exploration and modelling, it produces a graphical summary of the results, and it generates a more concise report of the distinguishing and consensus statements. This paper introduces the methodology and explains how to use the package, its advantages as well as its limitations. I illustrate the main functions with a dataset on value patterns about democracy.
gset: An R Package for Exact Sequential Test of Equivalence Hypothesis Based on Bivariate Non-Central t-Statistics
The R package *gset* calculates equivalence and futility boundaries based on the exact bivariate non-central $t$ test statistics. It is the first R package that targets specifically at the group sequential test of equivalence hypotheses. The exact test approach adopted by *gset* neither assumes the large-sample normality of the test statistics nor ignores the contribution to the overall Type I error rate from rejecting one out of the two one-sided hypotheses under a null value. The features of *gset* include: error spending functions, computation of equivalence boundaries and futility boundaries, either binding or nonbinding, depiction of stagewise boundary plots, and operating characteristics of a given group sequential design including empirical Type I error rate, empirical power, expected sample size, and probability of stopping at an interim look due to equivalence or futility.
sgof: An R Package for Multiple Testing Problems
In this paper we present a new R package called *sgof* for multiple hypothesis testing. The principal aim of this package is to implement SGoF-type multiple testing methods, known to be more powerful than the classical false discovery rate (FDR) and family-wise error rate (FWER) based methods in certain situations, particularly when the number of tests is large. This package includes Binomial and Conservative SGoF and the Bayesian and Beta-Binomial SGoF multiple testing procedures, which are adaptations of the original SGoF method to the Bayesian setting and to possibly correlated tests, respectively. The *sgof* package also implements the Benjamini-Hochberg and Benjamini-Yekutieli FDR controlling procedures. For each method the package provides (among other things) the number of rejected null hypotheses, estimation of the corresponding FDR, and the set of adjusted $p$ values. Some automatic plots of interest are implemented too. Two real data examples are used to illustrate how *sgof* works.
Coordinate-Based Meta-Analysis of fMRI Studies with R
This paper outlines how to conduct a simple meta-analysis of neuroimaging foci of activation in R. In particular, the first part of this paper reviews the nature of fMRI data, and presents a brief overview of the existing packages that can be used to analyze fMRI data in R. The second part illustrates how to handle fMRI data by showing how to visualize the results of different neuroimaging studies in a so-called orthographic view, where the spatial distribution of the foci of activation from different fMRI studies can be inspected visually.
phaseR: An R Package for Phase Plane Analysis of Autonomous ODE Systems
When modelling physical systems, analysts will frequently be confronted by differential equations which cannot be solved analytically. In this instance, numerical integration will usually be the only way forward. However, for autonomous systems of ordinary differential equations (ODEs) in one or two dimensions, it is possible to employ an instructive qualitative analysis foregoing this requirement, using so-called phase plane methods. Moreover, this qualitative analysis can even prove to be highly useful for systems that can be solved analytically, or will be solved numerically anyway. The package *phaseR* allows the user to perform such phase plane analyses: determining the stability of any equilibrium points easily, and producing informative plots.
Applying spartan to Understand Parameter Uncertainty in Simulations
In attempts to further understand the dynamics of complex systems, the application of computer simulation is becoming increasingly prevalent. Whereas a great deal of focus has been placed in the development of software tools that aid researchers develop simulations, similar focus has not been applied in the creation of tools that perform a rigorous statistical analysis of results generated through simulation: vital in understanding how these results offer an insight into the captured system. This encouraged us to develop *spartan*, a package of statistical techniques designed to assist researchers in understanding the relationship between their simulation and the real system. Previously we have described each technique within *spartan* in detail, with an accompanying immunology case study examining the development of lymphoid tissue. Here we provide a practical introduction to the package, demonstrating how each technique is run in R, to assist researchers in integrating this package alongside their chosen simulation platform.
Prinsimp
Principal Components Analysis (PCA) is a common way to study the sources of variation in a high-dimensional data set. Typically, the leading principal components are used to understand the variation in the data or to reduce the dimension of the data for subsequent analysis. The remaining principal components are ignored since they explain little of the variation in the data. However, the space spanned by the low variation principal components may contain interesting structure, structure that PCA cannot find. *Prinsimp* is an R package that looks for interesting structure of low variability. "Interesting" is defined in terms of a simplicity measure. Looking for interpretable structure in a low variability space has particular importance in evolutionary biology, where such structure can signify the existence of a genetic constraint.
Automatic Conversion of Tables to LongForm Dataframes
*TableToLongForm* automatically converts hierarchical Tables intended for a human reader into a simple LongForm dataframe that is machine readable, making it easier to access and use the data for analysis. It does this by recognising positional cues present in the hierarchical Table (which would normally be interpreted visually by the human brain) to decompose, then reconstruct the data into a LongForm dataframe. The article motivates the benefit of such a conversion with an example Table, followed by a short user manual, which includes a comparison between the simple one argument call to `TableToLongForm`, with code for an equivalent manual conversion. The article then explores the types of Tables the package can convert by providing a gallery of all recognised patterns. It finishes with a discussion of available diagnostic methods and future work.
A Multiscale Test of Spatial Stationarity for Textured Images in R
The ability to automatically identify areas of homogeneous texture present within a greyscale image is an important feature of image processing algorithms. This article describes the R package ***LS2Wstat*** which employs a recent wavelet-based test of stationarity for locally stationary random fields to assess such spatial homogeneity. By embedding this test within a quadtree image segmentation procedure we are also able to identify texture regions within an image.
ROSE: A Package for Binary Imbalanced Learning
The *ROSE* package provides functions to deal with binary classification problems in the presence of imbalanced classes. Artificial balanced samples are generated according to a smoothed bootstrap approach and allow for aiding both the phases of estimation and accuracy evaluation of a binary classifier in the presence of a rare class. Functions that implement more traditional remedies for the class imbalance and different metrics to evaluate accuracy are also provided. These are estimated by holdout, bootstrap, or cross-validation methods.
Web Technologies Task View
This article presents the CRAN Task View on Web Technologies. We describe the most important aspects of Web Technologies and Web Scraping and list some of the packages that are currently available on CRAN. Finally, we plot the network of Web Technology related package dependencies.
brainR: Interactive 3 and 4D Images of High Resolution Neuroimage Data
We provide software tools for displaying and publishing interactive 3-dimensional (3D) and 4-dimensional (4D) figures to html webpages, with examples of high-resolution brain imaging. Our framework is based in the R statistical software using the *rgl* package, a 3D graphics library. We build on this package to allow manipulation of figures including rotation and translation, zooming, coloring of brain substructures, adjusting transparency levels, and addition/or removal of brain structures. The need for better visualization tools of ultra high dimensional data is ever present; we are providing a clean, simple, web-based option. We also provide a package (*brainR*) for users to readily implement these tools.
The gridSVG Package
The *gridSVG* package can be used to generate a *grid*-based R plot in an SVG format, with the ability to add special effects to the plot. The special effects include animation, interactivity, and advanced graphical features, such as masks and filters. This article provides a basic introduction to important functions in the *gridSVG* package and discusses the advantages and disadvantages of *gridSVG* compared to similar R packages.
PivotalR: A Package for Machine Learning on Big Data
*PivotalR* is an R package that provides a front-end to PostgreSQL and all PostgreSQL-like databases such as Pivotal Inc.'s Greenplum Database (GPDB), HAWQ. When running on the products of Pivotal Inc., *PivotalR* utilizes the full power of parallel computation and distributive storage, and thus gives the normal R user access to big data. *PivotalR* also provides an R wrapper for MADlib. MADlib is an open-source library for scalable in-database analytics. It provides data-parallel implementations of mathematical, statistical and machine-learning algorithms for structured and unstructured data. Thus *PivotalR* also enables the user to apply machine learning algorithms on big data.
investr: An R Package for Inverse Estimation
Inverse estimation is a classical and well-known problem in regression. In simple terms, it involves the use of an observed value of the response to make inference on the corresponding unknown value of the explanatory variable. To our knowledge, however, statistical software is somewhat lacking the capabilities for analyzing these types of problems. In this paper, we introduce *investr* (which stands for **inv**erse **est**imation in **R**), a package for solving inverse estimation problems in both linear and nonlinear regression models.[^1]
oligoMask: A Framework for Assessing and Removing the Effect of Genetic Variants on Microarray Probes
As expression microarrays are typically designed relative to a reference genome, any individual genetic variant that overlaps a probe's genomic position can possibly cause a reduction in hybridization due to the probe no longer being a perfect match to a given sample's mRNA at that locus. If the samples or groups used in a microarray study differ in terms of genetic variants, the results of the microarray experiment can be negatively impacted. The *oligoMask* package is an R/SQLite framework which can utilize publicly available genetic variants and works in conjunction with the *oligo* package to read in the expression data and remove microarray probes which are likely to impact a given microarray experiment prior to analysis. Tools are provided for creating an SQLite database containing the probe and variant annotations and for performing the commonly used RMA preprocessing procedure for Affymetrix microarrays. The *oligoMask* package is freely available at <https://github.com/dbottomly/oligoMask>.
The stringdist Package for Approximate String Matching
Comparing text strings in terms of distance functions is a common and fundamental task in many statistical text-processing applications. Thus far, string distance functionality has been somewhat scattered around R and its extension packages, leaving users with inconistent interfaces and encoding handling. The *stringdist* package was designed to offer a low-level interface to several popular string distance algorithms which have been re-implemented in C for this purpose. The package offers distances based on counting $q$-grams, edit-based distances, and some lesser known heuristic distance functions. Based on this functionality, the package also offers inexact matching equivalents of R's native exact matching functions `match` and `%in%`.
The RWiener Package: an R Package Providing Distribution Functions for the Wiener Diffusion Model
We present the *RWiener* package that provides R functions for the Wiener diffusion model. The core of the package are the four distribution functions `dwiener`, `pwiener`, `qwiener` and `rwiener`, which use up-to-date methods, implemented in C, and provide fast and accurate computation of the density, distribution, and quantile function, as well as a random number generator for the Wiener diffusion model. We used the typical Wiener diffusion model with four parameters: boundary separation, non-decision time, initial bias and drift rate parameter. Beyond the distribution functions, we provide extended likelihood-based functions that can be used for parameter estimation and model selection. The package can be obtained via CRAN.
rotations: An R Package for SO(3) Data
In this article we introduce the *rotations* package which provides users with the ability to simulate, analyze and visualize three-dimensional rotation data. More specifically it includes four commonly used distributions from which to simulate data, four estimators of the central orientation, six confidence region estimation procedures and two approaches to visualizing rotation data. All of these features are available for two different parameterizations of rotations: three-by-three matrices and quaternions. In addition, two datasets are included that illustrate the use of rotation data in practice.
MRCV: A Package for Analyzing Categorical Variables with Multiple Response Options
Multiple response categorical variables (MRCVs), also known as "pick any" or "choose all that apply" variables, summarize survey questions for which respondents are allowed to select more than one category response option. Traditional methods for analyzing the association between categorical variables are not appropriate with MRCVs due to the within-subject dependence among responses. We have developed the ***MRCV*** package as the first R package available to correctly analyze MRCV data. Statistical methods offered by our package include counterparts to traditional Pearson chi-square tests for independence and loglinear models, where bootstrap methods and Rao-Scott adjustments are relied on to obtain valid inferences. We demonstrate the primary functions within the package by analyzing data from a survey assessing the swine waste management practices of Kansas farmers.
sgr: A Package for Simulating Conditional Fake Ordinal Data
Many self-report measures of attitudes, beliefs, personality, and pathology include items that can be easily manipulated by respondents. For example, an individual may deliberately attempt to manipulate or distort responses to simulate grossly exaggerated physical or psychological symptoms in order to reach specific goals such as, for example, obtaining financial compensation, avoiding being charged with a crime, avoiding military duty, or obtaining drugs. This article introduces the package *sgr* that can be used to perform fake data analysis according to the sample generation by replacement approach. The package includes functions for making simple inferences about discrete/ordinal fake data. The package allows to quantify uncertainty in inferences based on possible fake data as well as to study the implications of fake data for empirical results.
RStorm: Developing and Testing Streaming Algorithms in R
Streaming data, consisting of indefinitely evolving sequences, are becoming ubiquitous in many branches of science and in various applications. Computer scientists have developed streaming applications such as Storm and the S4 distributed stream computing platform[^1] to deal with data streams. However, in current production packages testing and evaluating streaming algorithms is cumbersome. This paper presents *RStorm* for the development and evaluation of streaming algorithms analogous to these production packages, but implemented fully in R. *RStorm* allows developers of streaming algorithms to quickly test, iterate, and evaluate various implementations of streaming algorithms. The paper provides both a canonical computer science example, the streaming word count, and examples of several statistical applications of *RStorm*.
Taming PITCHf/x Data with XML2R and pitchRx
*XML2R* is a framework that reduces the effort required to transform XML content into tables in a way that preserves parent to child relationships. *pitchRx* applies *XML2R*'s grammar for XML manipulation to Major League Baseball Advanced Media (MLBAM)'s Gameday data. With *pitchRx*, one can easily obtain and store Gameday data in a remote database. The Gameday website hosts a wealth of XML data, but perhaps most interesting is PITCHf/x. Among other things, PITCHf/x data can be used to recreate a baseball's flight path from a pitcher's hand to home plate. With *pitchRx*, one can easily create animations and interactive 3D scatterplots of the baseball's flight path. PITCHf/x data is also commonly used to generate a static plot of baseball locations at the moment they cross home plate. These plots, sometimes called strike-zone plots, can also refer to a plot of event probabilities over the same region. *pitchRx* provides an easy and robust way to generate strike-zone plots using the *ggplot2* package.
Stratified Weibull Regression Model for Interval-Censored Data
Interval censored outcomes arise when a silent event of interest is known to have occurred within a specific time period determined by the times of the last negative and first positive diagnostic tests. There is a rich literature on parametric and non-parametric approaches for the analysis of interval-censored outcomes. A commonly used strategy is to use a proportional hazards (PH) model with the baseline hazard function parameterized. The proportional hazards assumption can be relaxed in stratified models by allowing the baseline hazard function to vary across strata defined by a subset of explanatory variables. In this paper, we describe and implement a new R package ***straweib***, for fitting a stratified Weibull model appropriate for interval censored outcomes. We illustrate the R package ***straweib*** by analyzing data from a longitudinal oral health study on the timing of the emergence of permanent teeth in 4430 children.
Rankcluster: An R Package for Clustering Multivariate Partial Rankings
The ***Rankcluster*** package is the first R package proposing both modeling and clustering tools for ranking data, potentially multivariate and partial. Ranking data are modeled by the Insertion Sorting Rank ([isr]{.smallcaps}) model, which is a meaningful model parametrized by a central ranking and a dispersion parameter. A conditional independence assumption allows multivariate rankings to be taken into account, and clustering is performed by means of mixtures of multivariate [isr]{.smallcaps} models. The parameters of the cluster (central rankings and dispersion parameters) help the practitioners to interpret the clustering. Moreover, the ***Rankcluster*** package provides an estimate of the missing ranking positions when rankings are partial. After an overview of the mixture of multivariate [isr]{.smallcaps} models, the ***Rankcluster*** package is described and its use is illustrated through the analysis of two real datasets.
Archiving Reproducible Research with R and Dataverse
Reproducible research and data archiving are increasingly important issues in research involving statistical analyses of quantitative data. This article introduces the [*dvn*](https://CRAN.R-project.org/package=dvn) package, which allows R users to publicly archive datasets, analysis files, codebooks, and associated metadata in Dataverse Network online repositories, an open-source data archiving project sponsored by Harvard University. In this article I review the importance of data archiving in the context of reproducible research, introduce the Dataverse Network, explain the implementation of the *dvn* package, and provide example code for archiving and releasing data using the package.
Addendum to "Statistical Software from a Blind Person's Perspective"
This short note explains a solution to a problem for blind users when using the R terminal under Windows Vista or Windows 7, as identified in [@GodfreyRJournal]. We note the way the solution was discovered and subsequent confirmatory experiments.
Dynamic Parallelization of R Functions
R offers several extension packages that allow it to perform parallel computations. These operate on fixed points in the program flow and make it difficult to deal with nested parallelism and to organize parallelism in complex computations in general. In this article we discuss, first, of how to detect parallelism in functions, and second, how to minimize user intervention in that process. We present a solution that requires minimal code changes and enables to flexibly and dynamically choose the degree of parallelization in the resulting computation. An implementation is provided by the R package *parallelize.dynamic* and practical issues are discussed with the help of examples.
betategarch: Simulation, Estimation and Forecasting of Beta-Skew-t-EGARCH Models
This paper illustrates the usage of the *betategarch* package, a package for the simulation, estimation and forecasting of Beta-Skew-t-EGARCH models. The Beta-Skew-t-EGARCH model is a dynamic model of the scale or volatility of financial returns. The model is characterised by its robustness to jumps or outliers, and by its exponential specification of volatility. The latter enables richer dynamics, since parameters need not be restricted to be positive to ensure positivity of volatility. In addition, the model also allows for heavy tails and skewness in the conditional return (i.e. scaled return), and for leverage and a time-varying long-term component in the volatility specification. More generally, the model can be viewed as a model of the scale of the error in a dynamic regression.
The R in Robotics
The aim of this contribution is to connect two previously separated worlds: robotic application development with the Robot Operating System (ROS) and statistical programming with R. This fruitful combination becomes apparent especially in the analysis and visualization of sensory data. We therefore introduce a new language extension for ROS that allows to implement nodes in pure R. All relevant aspects are described in a step-by-step development of a common sensor data transformation node. This includes the reception of raw sensory data via the ROS network, message interpretation, bag-file analysis, transformation and visualization, as well as the transmission of newly generated messages back into the ROS network.
factorplot: Improving Presentation of Simple Contrasts in Generalized Linear Models
Recent statistical literature has paid attention to the presentation of pairwise comparisons either from the point of view of the reference category problem in generalized linear models (GLMs) or in terms of multiple comparisons. Both schools of thought are interested in the parsimonious presentation of sufficient information to enable readers to evaluate the significance of contrasts resulting from the inclusion of qualitative variables in GLMs. These comparisons also arise when trying to interpret multinomial models where one category of the dependent variable is omitted as a reference. While considerable advances have been made, opportunities remain to improve the presentation of this information, especially in graphical form. The *factorplot* package provides new functions for graphically and numerically presenting results of hypothesis tests related to pairwise comparisons resulting from qualitative covariates in GLMs or coefficients in multinomial logistic regression models.
CompLognormal: An R Package for Composite Lognormal Distributions
In recent years, composite models based on the lognormal distribution have become popular in actuarial sciences and related areas. In this short note, we present a new R package for computing the probability density function, cumulative density function, and quantile function, and for generating random numbers of any composite model based on the lognormal distribution. The use of the package is illustrated using a real data set.
lfe: Linear Group Fixed Effects
Linear models with fixed effects and many dummy variables are common in some fields. Such models are straightforward to estimate unless the factors have *too many* levels. The R package *lfe* solves this problem by implementing a generalization of the **within transformation** to multiple factors, tailored for large problems.
On Sampling from the Multivariate t Distribution
The multivariate normal and the multivariate $t$ distributions belong to the most widely used multivariate distributions in statistics, quantitative risk management, and insurance. In contrast to the multivariate normal distribution, the parameterization of the multivariate $t$ distribution does not correspond to its moments. This, paired with a non-standard implementation in the [R]{.sans-serif} package [*mvtnorm*](https://CRAN.R-project.org/package=mvtnorm), provides traps for working with the multivariate $t$ distribution. In this paper, common traps are clarified and corresponding recent changes to *mvtnorm* are presented.
rlme: An R Package for Rank-Based Estimation and Prediction in Random Effects Nested Models
There is a lack of robust statistical analyses for random effects linear models. In practice, statistical analyses, including estimation, prediction and inference, are not reliable when data are unbalanced, of small size, contain outliers, or not normally distributed. It is fortunate that rank-based regression analysis is a robust nonparametric alternative to likelihood and least squares analysis. We propose an R package that calculates rank-based statistical analyses for two- and three-level random effects nested designs. In this package, a new algorithm which recursively obtains robust predictions for both scale and random effects is used, along with three rank-based fitting methods.
RNetCDF -- A Package for Reading and Writing NetCDF Datasets
This paper describes the *RNetCDF* package (version 1.6), an interface for reading and writing files in Unidata NetCDF format, and gives an introduction to the NetCDF file format. NetCDF is a machine independent binary file format which allows storage of different types of array based data, along with short metadata descriptions. The package presented here allows access to the most important functions of the NetCDF C-interface for reading, writing, and modifying NetCDF datasets. In this paper, we present a short overview on the NetCDF file format and show usage examples of the package.
spMC: Modelling Spatial Random Fields with Continuous Lag Markov Chains
Currently, a part of the R statistical software is developed in order to deal with spatial models. More specifically, some available packages allow the user to analyse categorical spatial random patterns. However, only the *spMC* package considers a viewpoint based on transition probabilities between locations. Through the use of this package it is possible to analyse the spatial variability of data, make inference, predict and simulate the categorical classes in unobserved sites. An example is presented by analysing the well-known Swiss Jura data set.
Changes to grid for R 3.0.0
From R 3.0.0, there is a new recommended way to develop new grob classes in *grid*. In a nutshell, two new "hook" functions, `makeContext()` and `makeContent()` have been added to *grid* to provide an alternative to the existing hook functions `preDrawDetails()`, `drawDetails()`, and `postDrawDetails()`. There is also a new function called `grid.force()`. This article discusses why these changes have been made, provides a simple demonstration of the use of the new functions, and discusses some of the implications for packages that build on *grid*.
Performance Attribution for Equity Portfolios
The *pa* package provides tools for conducting performance attribution for long-only, single currency equity portfolios. The package uses two methods: the Brinson-Hood-Beebower model (hereafter referred to as the Brinson model) and a regression-based analysis. The Brinson model takes an ANOVA-type approach and decomposes the active return of any portfolio into asset allocation, stock selection, and interaction effect. The regression-based analysis utilizes estimated coefficients, based on a regression model, to attribute active return to different factors.
Surface Melting Curve Analysis with R
Nucleic acid *Melting Curve Analysis* is a powerful method to investigate the interaction of double stranded nucleic acids. Many researchers rely on closed source software which is not ubiquitously available, and gives only little control over the computation and data presentation. R in contrast, is open source, highly adaptable and provides numerous utilities for data import, sophisticated statistical analysis and presentation in publication quality. This article covers methods, implemented in the *MBmca* package, for DNA Melting Curve Analysis on microbead surfaces. Particularly, the use of the second derivative melting peaks is suggested as an additional parameter to characterize the melting behavior of DNA duplexes. Examples of microbead surface Melting Curve Analysis on fragments of human genes are presented.
Temporal Disaggregation of Time Series
Temporal disaggregation methods are used to disaggregate low frequency time series to higher frequency series, where either the sum, the average, the first or the last value of the resulting high frequency series is consistent with the low frequency series. Temporal disaggregation can be performed with or without one or more high frequency indicator series. The package *tempdisagg* is a collection of several methods for temporal disaggregation.
ExactCIdiff: An R Package for Computing Exact Confidence Intervals for the Difference of Two Proportions
Comparing two proportions through the difference is a basic problem in statistics and has applications in many fields. More than twenty confidence intervals [@Newcombe1998Improved; @Newcombe1998Interval] have been proposed. Most of them are approximate intervals with an asymptotic infimum coverage probability much less than the nominal level. In addition, large sample may be costly in practice. So exact optimal confidence intervals become critical for drawing valid statistical inference with accuracy and precision. Recently, [@Wang2010Construction; @Wang2012Inductive] derived the exact smallest (optimal) one-sided $1-\alpha$ confidence intervals for the difference of two paired or independent proportions. His intervals, however, are computer-intensive by nature. In this article, we provide an R package *ExactCIdiff* to implement the intervals when the sample size is not large. This would be the first available package in R to calculate the exact confidence intervals for the difference of proportions. Exact two-sided $1-\alpha$ interval can be easily obtained by taking the intersection of the lower and upper one-sided $1-\alpha/2$ intervals. Readers may jump to Examples 1 and 2 to obtain these intervals.
Translating Probability Density Functions: From R to BUGS and Back Again
The ability to implement statistical models in the BUGS language facilitates Bayesian inference by automating MCMC algorithms. Software packages that interpret the BUGS language include OpenBUGS, WinBUGS, and JAGS. R packages that link BUGS software to the R environment, including [*rjags*](https://CRAN.R-project.org/package=rjags) and [*R2WinBUGS*](https://CRAN.R-project.org/package=R2WinBUGS), are widely used in Bayesian analysis. Indeed, many packages in the Bayesian task view on CRAN (<http://cran.r-project.org/web/views/Bayesian.html>) depend on this integration. However, the R and BUGS languages use different representations of common probability density functions, creating a potential for errors to occur in the implementation or interpretation of analyses that use both languages. Here we review different parameterizations used by the R and BUGS languages, describe how to translate between the languages, and provide an R function, `r2bugs.distributions`, that transforms parameterizations from R to BUGS and back again.
PIN: Measuring Asymmetric Information in Financial Markets with R
The package *PIN* computes a measure of asymmetric information in financial markets, the so-called probability of informed trading. This is obtained from a sequential trade model and is used to study the determinants of an asset price. Since the probability of informed trading depends on the number of buy- and sell-initiated trades during a trading day, this paper discusses the entire modelling cycle, from data handling to the computation of the probability of informed trading and the estimation of parameters for the underlying theoretical model.
Fast Pure R Implementation of GEE: Application of the Matrix Package
Generalized estimating equation solvers in R only allow for a few pre-determined options for the link and variance functions. We provide a package, *geeM*, which is implemented entirely in R and allows for user specified link and variance functions. The sparse matrix representations provided in the *Matrix* package enable a fast implementation. To gain speed, we make use of analytic inverses of the working correlation when possible and a trick to find quick numeric inverses when an analytic inverse is not available. Through three examples, we demonstrate the speed of *geeM*, which is not much worse than C implementations like *geepack* and *gee* on small data sets and faster on large data sets.
RTextTools: A Supervised Learning Package for Text Classification
Social scientists have long hand-labeled texts to create datasets useful for studying topics from congressional policymaking to media reporting. Many social scientists have begun to incorporate machine learning into their toolkits. [*RTextTools*](https://CRAN.R-project.org/package=RTextTools) was designed to make machine learning accessible by providing a start-to-finish product in less than 10 steps. After installing [*RTextTools*](https://CRAN.R-project.org/package=RTextTools), the initial step is to generate a document term matrix. Second, a container object is created, which holds all the objects needed for further analysis. Third, users can use up to nine algorithms to train their data. Fourth, the data are classified. Fifth, the classification is summarized. Sixth, functions are available for performance evaluation. Seventh, ensemble agreement is conducted. Eighth, users can cross-validate their data. Finally, users write their data to a spreadsheet, allowing for further manual coding if required.
Generalized Simulated Annealing for Global Optimization: The GenSA Package
Many problems in statistics, finance, biology, pharmacology, physics, mathematics, economics, and chemistry involve determination of the global minimum of multidimensional functions. R packages for different stochastic methods such as genetic algorithms and differential evolution have been developed and successfully used in the R community. Based on Tsallis statistics, the R package GenSA was developed for generalized simulated annealing to process complicated non-linear objective functions with a large number of local minima. In this paper we provide a brief introduction to the R package and demonstrate its utility by solving a non-convex portfolio optimization problem in finance and the Thomson problem in physics. *GenSA* is useful and can serve as a complementary tool to, rather than a replacement for, other widely used R packages for optimization.
Multiple Factor Analysis for Contingency Tables in the *FactoMineR* Package
We present multiple factor analysis for contingency tables (MFACT) and its implementation in the *FactoMineR* package. This method, through an option of the `MFA` function, allows us to deal with multiple contingency or frequency tables, in addition to the categorical and quantitative multiple tables already considered in previous versions of the package. Thanks to this revised function, either a multiple contingency table or a mixed multiple table integrating quantitative, categorical and frequency data can be tackled.
Hypothesis Tests for Multivariate Linear Models Using the car Package
The multivariate linear model is $$\underset{(n\times m)}{\mathbf{Y}}=\underset{(n\times p)}{\mathbf{X}}\underset{(p\times m)}{\mathbf{B}}+\underset{(n\times m)}{\mathbf{E}}%$$ The multivariate linear model can be fit with the `lm` function in R, where the left-hand side of the model comprises a matrix of response variables, and the right-hand side is specified exactly as for a univariate linear model (i.e., with a single response variable). This paper explains how to use the `Anova` and `linearHypothesis` functions in the *car* package to perform convenient hypothesis tests for parameters in multivariate linear models, including models for repeated-measures data.
osmar: OpenStreetMap and R
OpenStreetMap provides freely accessible and editable geographic data. The *osmar* package smoothly integrates the OpenStreetMap project into the R ecosystem. The *osmar* package provides infrastructure to access OpenStreetMap data from different sources, to enable working with the OSM data in the familiar R idiom, and to convert the data into objects based on classes provided by existing R packages. This paper explains the package's concept and shows how to use it. As an application we present a simple navigation device.
ftsa: An R Package for Analyzing Functional Time Series
Recent advances in computer recording and storing technology have tremendously increased the presence of functional data, whose graphical representation can be infinite-dimensional curve, image, or shape. When the same functional object is observed over a period of time, such data are known as functional time series. This article makes first attempt to describe several techniques (centered around functional principal component analysis) for modeling and forecasting functional time series from a computational aspect, using a readily-available R addon package. These methods are demonstrated using age-specific Australian fertility rate data from 1921 to 2006, and monthly sea surface temperature data from January 1950 to December 2011.
Statistical Software from a Blind Person's Perspective
Blind people have experienced access issues to many software applications since the advent of the Windows operating system; statistical software has proven to follow the rule and not be an exception. The ability to use R within minutes of download with next to no adaptation has opened doors for accessible production of statistical analyses for this author (himself blind) and blind students around the world. This article shows how little is required to make R the most accessible statistical software available today. There is any number of ramifications that this opportunity creates for blind students, especially in terms of their future research and employment prospects. There is potential for making R even better for blind users. The extensibility of R makes this possible through added functionality being made available in an add-on package called *BrailleR*. Functions in this package are intended to make graphical information available in text form.
QCA: A Package for Qualitative Comparative Analysis
We present *QCA*, a package for performing Qualitative Comparative Analysis (QCA). QCA is becoming increasingly popular with social scientists, but none of the existing software alternatives covers the full range of core procedures. This gap is now filled by *QCA*. After a mapping of the method's diffusion, we introduce some of the package's main capabilities, including the calibration of crisp and fuzzy sets, the analysis of necessity relations, the construction of truth tables and the derivation of complex, parsimonious and intermediate solutions.
An Introduction to the EcoTroph R Package: Analyzing Aquatic Ecosystem Trophic Networks
Recent advances in aquatic ecosystem modelling have particularly focused on trophic network analysis through trophodynamic models. We present here a R package devoted to a recently developed model, *EcoTroph*. This model enables the analysis of aquatic ecological networks and the related impacts of fisheries. It was available through a plug-in in the well-known Ecopath with Ecosim software or through implementations in Excel sheets. The R package we developed simplifies the access to the EcoTroph model and offers a new interfacing between two widely used software, Ecopath and R.
stellaR: A Package to Manage Stellar Evolution Tracks and Isochrones
We present the R package *stellaR*, which is designed to access and manipulate publicly available stellar evolutionary tracks and isochrones from the Pisa low-mass database. The procedures for extracting important stages in the evolution of a star from the database, for constructing isochrones from stellar tracks and for interpolating among tracks are discussed and demonstrated.
Let Graphics Tell the Story - Datasets in R
Graphics are good for showing the information in datasets and for complementing modelling. Sometimes graphics show information models miss, sometimes graphics help to make model results more understandable, and sometimes models show whether information from graphics has statistical support or not. It is the interplay of the two approaches that is valuable. Graphics could be used a lot more in R examples and we explore this idea with some datasets available in R packages.
Estimating Spatial Probit Models in R
In this article we present the Bayesian estimation of spatial probit models in R and provide an implementation in the package *spatialprobit*. We show that large probit models can be estimated with sparse matrix representations and Gibbs sampling of a truncated multivariate normal distribution with the precision matrix. We present three examples and point to ways to achieve further performance gains through parallelization of the Markov Chain Monte Carlo approach.
ggmap: Spatial Visualization with ggplot2
In spatial statistics the ability to visualize data and models superimposed with their basic social landmarks and geographic context is invaluable. *ggmap* is a new tool which enables such visualization by combining the spatial information of static maps from Google Maps, OpenStreetMap, Stamen Maps or CloudMade Maps with the layered grammar of graphics implementation of *ggplot2*. In addition, several new utility functions are introduced which allow the user to access the Google Geocoding, Distance Matrix, and Directions APIs. The result is an easy, consistent and modular framework for spatial graphics with several convenient tools for spatial data analysis.
mpoly: Multivariate Polynomials in R
The *mpoly* package is a general purpose collection of tools for symbolic computing with multivariate polynomials in R. In addition to basic arithmetic, *mpoly* can take derivatives of polynomials, compute bases of collections of polynomials, and convert polynomials into a functional form to be evaluated. Among other things, it is hoped that *mpoly* will provide an R-based foundation for the computational needs of algebraic statisticians.
beadarrayFilter: An R Package to Filter Beads
Microarrays enable the expression levels of thousands of genes to be measured simultaneously. However, only a small fraction of these genes are expected to be expressed under different experimental conditions. Nowadays, filtering has been introduced as a step in the microarray pre-processing pipeline. Gene filtering aims at reducing the dimensionality of data by filtering redundant features prior to the actual statistical analysis. Previous filtering methods focus on the Affymetrix platform and can not be easily ported to the Illumina platform. As such, we developed a filtering method for Illumina bead arrays. We developed an R package, *beadarrayFilter*, to implement the latter method. In this paper, the main functions in the package are highlighted and using many examples, we illustrate how *beadarrayFilter* can be used to filter bead arrays.
RcmdrPlugin.temis, a Graphical Integrated Text Mining Solution in R
We present the package *RcmdrPlugin.temis*, a graphical user interface for user-friendly text mining in R. Built as a plug-in to the R Commander provided by the *Rcmdr* package, it brings together several existing packages and provides new features streamlining the process of importing, managing and analyzing a corpus, in addition to saving results and plots to a report file. Beyond common file formats, automated import of corpora from the Dow Jones Factiva content provider and Twitter is supported. Featured analyses include vocabulary and dissimilarity tables, terms frequencies, terms specific of levels of a variable, term co-occurrences, time series, correspondence analysis and hierarchical clustering.
Possible Directions for Improving Dependency Versioning in R
One of the most powerful features of R is its infrastructure for contributed code. The built-in package manager and complementary repositories provide a great system for development and exchange of code, and have played an important role in the growth of the platform towards the de-facto standard in statistical computing that it is today. However, the number of packages on CRAN and other repositories has increased beyond what might have been foreseen, and is revealing some limitations of the current design. One such problem is the general lack of dependency versioning in the infrastructure. This paper explores this problem in greater detail, and suggests approaches taken by other open source communities that might work for R as well. Three use cases are defined that exemplify the issue, and illustrate how improving this aspect of package management could increase reliability while supporting further growth of the R community.
frailtyHL: A Package for Fitting Frailty Models with H-likelihood
We present the *frailtyHL* package for fitting semi-parametric frailty models using h-likelihood. This package allows lognormal or gamma frailties for random-effect distribution, and it fits shared or multilevel frailty models for correlated survival data. Functions are provided to format and summarize the *frailtyHL* results. The estimates of fixed effects and frailty parameters and their standard errors are calculated. We illustrate the use of our package with three well-known data sets and compare our results with various alternative R-procedures.
influence.ME: Tools for Detecting Influential Data in Mixed Effects Models
[*influence.ME*](https://CRAN.R-project.org/package=influence.ME) provides tools for detecting influential data in mixed effects models. The application of these models has become common practice, but the development of diagnostic tools has lagged behind. [*influence.ME*](https://CRAN.R-project.org/package=influence.ME) calculates standardized measures of influential data for the point estimates of generalized mixed effects models, such as DFBETAS, Cook's distance, as well as percentile change and a test for changing levels of significance. [*influence.ME*](https://CRAN.R-project.org/package=influence.ME) calculates these measures of influence while accounting for the nesting structure of the data. The package and measures of influential data are introduced, a practical example is given, and strategies for dealing with influential data are suggested.
The crs Package: Nonparametric Regression Splines for Continuous and Categorical Predictors
A new package *crs* is introduced for computing nonparametric regression (and quantile) splines in the presence of both continuous and categorical predictors. B-splines are employed in the regression model for the continuous predictors and kernel weighting is employed for the categorical predictors. We also develop a simple R interface to NOMAD, which is a mixed integer optimization solver used to compute optimal regression spline solutions.
Debugging grid Graphics
A graphical scene that has been produced using the *grid* graphics package consists of grobs (graphical objects) and viewports. This article describes functions that allow the exploration and inspection of the grobs and viewports in a *grid* scene, including several functions that are available in a new package called *gridDebug*. The ability to explore the grobs and viewports in a *grid* scene is useful for adding more drawing to a scene that was produced using *grid* and for understanding and debugging the *grid* code that produced a scene.
Rfit: Rank-based Estimation for Linear Models
In the nineteen seventies, Jurečková and Jaeckel proposed rank estimation for linear models. Since that time, several authors have developed inference and diagnostic methods for these estimators. These rank-based estimators and their associated inference are highly efficient and are robust to outliers in response space. The methods include estimation of standard errors, tests of general linear hypotheses, confidence intervals, diagnostic procedures including studentized residuals, and measures of influential cases. We have developed an R package, [*Rfit*](https://CRAN.R-project.org/package=Rfit), for computing of these robust procedures. In this paper we highlight the main features of the package. The package uses standard linear model syntax and includes many of the main inference and diagnostic functions.
Graphical Markov Models with Mixed Graphs in R
In this paper we provide a short tutorial illustrating the new functions in the package *ggm* that deal with ancestral, summary and ribbonless graphs. These are mixed graphs (containing three types of edges) that are important because they capture the modified independence structure after marginalisation over, and conditioning on, nodes of directed acyclic graphs. We provide functions to verify whether a mixed graph implies that $A$ is independent of $B$ given $C$ for any disjoint sets of nodes and to generate maximal graphs inducing the same independence structure of non-maximal graphs. Finally, we provide functions to decide on the Markov equivalence of two graphs with the same node set but different types of edges.
What's in a Name?
Any shape that is drawn using the [*grid*](https://CRAN.R-project.org/package=grid) graphics package can have a name associated with it. If a name is provided, it is possible to access, query, and modify the shape after it has been drawn. These facilities allow for very detailed customisations of plots and also for very general transformations of plots that are drawn by packages based on [*grid*](https://CRAN.R-project.org/package=grid).
It's Not What You Draw,\ It's What You Don't Draw
The R graphics engine has new support for drawing complex paths via the functions `polypath()` and `grid.path()`. This article explains what is meant by a complex path and demonstrates the usefulness of complex paths in drawing non-trivial shapes, logos, customised data symbols, and maps.
The State of Naming Conventions in R
Most programming language communities have naming conventions that are generally agreed upon, that is, a set of rules that governs how functions and variables are named. This is not the case with R, and a review of unofficial style guides and naming convention usage on CRAN shows that a number of different naming conventions are currently in use. Some naming conventions are, however, more popular than others and as a newcomer to the R community or as a developer of a new package this could be useful to consider when choosing what naming convention to adopt.
Analysing Seasonal Data
Many common diseases, such as the flu and cardiovascular disease, increase markedly in winter and dip in summer. These seasonal patterns have been part of life for millennia and were first noted in ancient Greece by both Hippocrates and Herodotus. Recent interest has focused on climate change, and the concern that seasons will become more extreme with harsher winter and summer weather. We describe a set of R functions designed to model seasonal patterns in disease. We illustrate some simple descriptive and graphical methods, a more complex method that is able to model non-stationary patterns, and the case-crossover to control for seasonal confounding.
MARSS: Multivariate Autoregressive State-space Models for Analyzing Time-series Data
MARSS is a package for fitting multivariate autoregressive state-space models to time-series data. The MARSS package implements state-space models in a maximum likelihood framework. The core functionality of MARSS is based on likelihood maximization using the Kalman filter/smoother, combined with an EM algorithm. To make comparisons with other packages available, parameter estimation is also permitted via direct search routines available in 'optim'. The MARSS package allows data to contain missing values and allows a wide variety of model structures and constraints to be specified (such as fixed or shared parameters). In addition to model-fitting, the package provides bootstrap routines for simulating data and generating confidence intervals, and multiple options for calculating model selection criteria (such as AIC).
openair -- Data Analysis Tools for the Air Quality Community
The [*openair*](https://CRAN.R-project.org/package=openair) package contains data analysis tools for the air quality community. This paper provides an overview of data importers, main functions, and selected utilities and workhorse functions within the package and the function output class, as of package version 0.4-14. It is intended as an explanation of the rationale for the package and a technical description for those wishing to work more interactively with the main functions or develop additional functions to support 'higher level' use of [*openair*](https://CRAN.R-project.org/package=openair) and R.
Foreign Library Interface
We present an improved Foreign Function Interface (FFI) for R to call arbitary native functions without the need for C wrapper code. Further we discuss a dynamic linkage framework for binding standard C libraries to R across platforms using a universal type information format. The package [*rdyncall*](https://CRAN.R-project.org/package=rdyncall) comprises the framework and an initial repository of cross-platform bindings for standard libraries such as (legacy and modern) *OpenGL*, the family of *SDL* libraries and *Expat*. The package enables system-level programming using the R language; sample applications are given in the article. We outline the underlying automation tool-chain that extracts cross-platform bindings from C headers, making the repository extendable and open for library developers.
Vdgraph: A Package for Creating Variance Dispersion Graphs
This article introduces the package [*Vdgraph*](https://CRAN.R-project.org/package=Vdgraph) that is used for making variance dispersion graphs of response surface designs. The package includes functions that make the variance dispersion graph of one design or compare variance dispersion graphs of two designs, which are stored in data frames or matrices. The package also contains several minimum run response surface designs (stored as matrices) that are not available in other R packages.
xgrid and R: Parallel Distributed Processing Using Heterogeneous Groups of Apple Computers
The Apple Xgrid system provides access to groups (or grids) of computers that can be used to facilitate parallel processing. We describe the *xgrid* package which facilitates access to this system to undertake independent simulations or other long-running jobs that can be divided into replicate runs within R. Detailed examples are provided to demonstrate the interface, along with results from a simulation study of the performance gains using a variety of grids. Use of the grid for "embarassingly parallel" independent jobs has the potential for major speedups in time to completion. Appendices provide guidance on setting up the workflow, utilizing add-on packages, and constructing grids using existing machines.
maxent: An R Package for Low-memory Multinomial Logistic Regression with Support for Semi-automated Text Classification
*maxent* is a package with tools for data classification using multinomial logistic regression, also known as maximum entropy. The focus of this maximum entropy classifier is to minimize memory consumption on very large datasets, particularly sparse document-term matrices represented by the *tm* text mining package.
Sumo: An Authenticating Web Application with an Embedded R Session
Sumo is a web application intended as a template for developers. It is distributed as a Java `war` file that deploys automatically when placed in a Servlet container's `webapps` directory. If a user supplies proper credentials, Sumo creates a session-specific Secure Shell connection to the host and a user-specific R session over that connection. Developers may write dynamic server pages that make use of the persistent R session and user-specific file space. The supplied example plots a data set conditional on preferences indicated by the user; it also displays some static text. A companion server page allows the user to interact directly with the R session. Sumo's novel feature set complements previous efforts to supply R functionality over the internet.
Who Did What? The Roles of R Package Authors and How to Refer to Them
Computational infrastructure for representing persons and citations has been available in R for several years, but has been restructured through enhanced classes `"person"` and `"bibentry"` in recent versions of R. The new features include support for the specification of the roles of package authors (e.g. maintainer, author, contributor, translator, etc.) and more flexible formatting/printing tools among various other improvements. Here, we introduce the new classes and their methods and indicate how this functionality is employed in the management of R packages. Specifically, we show how the authors of R packages can be specified along with their roles in package `DESCRIPTION` and/or `CITATION` files and the citations produced from it.
Creating and Deploying an Application with (R)Excel and R
We present some ways of using Rin Excel and build an example application using the package [*rpart*](https://CRAN.R-project.org/package=rpart). Starting with simple interactive use of [*rpart*](https://CRAN.R-project.org/package=rpart) in Excel, we eventually package the code into an Excel-based application, hiding all details (including R itself) from the end user. In the end, our application implements a service-oriented architecture (SOA) with a clean separation of presentation and computation layer.
glm2: Fitting Generalized Linear Models with Convergence Problems
The R function `glm` uses step-halving to deal with certain types of convergence problems when using iteratively reweighted least squares to fit a generalized linear model. This works well in some circumstances but non-convergence remains a possibility, particularly with a non-standard link function. In some cases this is because step-halving is never invoked, despite a lack of convergence. In other cases step-halving is invoked but is unable to induce convergence. One remedy is to impose a stricter form of step-halving than is currently available in `glm`, so that the deviance is forced to decrease in every iteration. This has been implemented in the `glm2` function available in the [*glm2*](https://CRAN.R-project.org/package=glm2) package. Aside from a modified computational algorithm, `glm2` operates in exactly the same way as `glm` and provides improved convergence properties. These improvements are illustrated here with an identity link Poisson model, but are also relevant in other contexts.
Implementing the Compendium Concept with Sweave and DOCSTRIP
This article suggests an implementation of the compendium concept by combining `Sweave` and the LaTeX literate programming environment `DOCSTRIP`.
Watch Your Spelling!
We discuss the facilities in base R for spell checking via Aspell, Hunspell or Ispell, which are useful in particular for conveniently checking the spelling of natural language texts in package Rd files and vignettes. Spell checking performance is illustrated using the Rd files in package *stats*. This example clearly indicates the need for a domain-specific statistical dictionary. We analyze the results of spell checking all Rd files in all CRAN packages and show how these can be employed for building such a dictionary.
Ckmeans.1d.dp: Optimal k-means Clustering in One Dimension by Dynamic Programming
\ The heuristic $k$-means algorithm, widely used for cluster analysis, does not guarantee optimality. We developed a dynamic programming algorithm for optimal one-dimensional clustering. The algorithm is implemented as an R package called [*Ckmeans.1d.dp*](https://CRAN.R-project.org/package=Ckmeans.1d.dp). We demonstrate its advantage in optimality and runtime over the standard iterative $k$-means algorithm.
Nonparametric Goodness-of-Fit Tests for Discrete Null Distributions
Methodology extending nonparametric goodness-of-fit tests to discrete null distributions has existed for several decades. However, modern statistical software has generally failed to provide this methodology to users. We offer a revision of R's `ks.test()` function and a new `cvm.test()` function that fill this need in the R language for two of the most popular nonparametric goodness-of-fit tests. This paper describes these contributions and provides examples of their usage. Particular attention is given to various numerical issues that arise in their implementation.
Using the Google Visualisation API with R
The [*googleVis*](https://CRAN.R-project.org/package=googleVis) package provides an interface between R and the Google Visualisation API to create interactive charts which can be embedded into web pages. The best known of these charts is probably the Motion Chart, popularised by Hans Rosling in his TED talks. With the [*googleVis*](https://CRAN.R-project.org/package=googleVis) package users can easily create web pages with interactive charts based on R data frames and display them either via the local R HTTP help server or within their own sites.
GrapheR: a Multiplatform GUI for Drawing Customizable Graphs in R
This article presents [*GrapheR*](https://CRAN.R-project.org/package=GrapheR), a Graphical User Interface allowing the user to draw customizable and high-quality graphs without knowing any R commands. Six kinds of graph are available: histograms, box-and-whisker plots, bar plots, pie charts, curves and scatter plots. The complete process is described with the examples of a bar plot and a scatter plot illustrating the legendary puzzle of African and European swallows' migrations.
rainbow: An R Package for Visualizing Functional Time Series
Recent advances in computer technology have tremendously increased the use of functional data, whose graphical representation can be infinite-dimensional curves, images or shapes. This article describes four methods for visualizing functional time series using an R add-on package. These methods are demonstrated using age-specific Australian fertility data from 1921 to 2006 and monthly sea surface temperatures from January 1950 to December 2006.
Portable C++ for R Packages
Package checking errors are more common on Solaris than Linux. In many cases, these errors are due to non-portable C++ code. This article reviews some commonly recurring problems in C++ code found in R packages and suggests solutions.
Rmetrics - timeDate Package
The management of time and holidays can prove crucial in applications that rely on historical data. A typical example is the aggregation of a data set recorded in different time zones and under different daylight saving time rules. Besides the time zone conversion function, which is well supported by default classes in R, one might need functions to handle special days or holidays. In this respect, the package [*timeDate*](https://CRAN.R-project.org/package=timeDate) enhances default date-time classes in R and brings new functionalities to time zone management and the creation of holiday calendars.
testthat: Get Started with Testing
Software testing is important, but many of us don't do it because it is frustrating and boring. *testthat* is a new testing framework for R that is easy learn and use, and integrates with your existing workflow. This paper shows how, with illustrations from existing packages.
Content-Based Social Network Analysis of Mailing Lists
Social Network Analysis (SNA) provides tools to examine relationships between people. Text Mining (TM) allows capturing the text they produce in Web 2.0 applications, for example, however it neglects their social structure. This paper applies an approach to combine the two methods named "content-based SNA". Using the R mailing lists, R-help and R-devel, we show how this combination can be used to describe people's interests and to find out if authors who have similar interests actually communicate. We find that the expected positive relationship between sharing interests and communicating gets stronger as the centrality scores of authors in the communication networks increase.
The digitize Package: Extracting Numerical Data from Scatterplots
I present the small R package [*digitize*](https://CRAN.R-project.org/package=digitize), designed to extract data from scatterplots with a simple method and suited to small datasets. I present an application of this method to the extraction of data from a graph whose source is not available.
Differential Evolution with DEoptim
The R package [*DEoptim*](https://CRAN.R-project.org/package=DEoptim) implements the Differential Evolution algorithm. This algorithm is an evolutionary technique similar to classic genetic algorithms that is useful for the solution of global optimization problems. In this note we provide an introduction to the package and demonstrate its utility for financial applications by solving a non-convex portfolio optimization problem.
rworldmap: A New R package for Mapping Global Data
[*rworldmap*](https://CRAN.R-project.org/package=rworldmap) is a relatively new package available on CRAN for the mapping and visualisation of global data. The vision is to make the display of global data easier, to facilitate understanding and communication. The initial focus is on data referenced by country or grid due to the frequency of use of such data in global assessments. Tools to link data referenced by country (either name or code) to a map, and then to display the map are provided as are functions to map global gridded data. Country and gridded functions accept the same arguments to specify the nature of categories and colour and how legends are formatted. This package builds on the functionality of existing packages, particularly [*sp*](https://CRAN.R-project.org/package=sp), [*maptools*](https://CRAN.R-project.org/package=maptools) and [*fields*](https://CRAN.R-project.org/package=fields). Example code is provided to produce maps, to link with the packages [*classInt*](https://CRAN.R-project.org/package=classInt), [*RColorBrewer*](https://CRAN.R-project.org/package=RColorBrewer) and [*ncdf*](https://CRAN.R-project.org/package=ncdf), and to plot examples of publicly available country and gridded data.
Cryptographic Boolean Functions with R
A new package called [*boolfun*](https://CRAN.R-project.org/package=boolfun) is available for R users. The package provides tools to handle Boolean functions, in particular for cryptographic purposes. This document guides the user through some (code) examples and gives a feel of what can be done with the package.
Probabilistic Weather Forecasting in R
This article describes two R packages for probabilistic weather forecasting, [*ensembleBMA*](https://CRAN.R-project.org/package=ensembleBMA), which offers ensemble postprocessing via Bayesian model averaging (BMA), and [*ProbForecastGOP*](https://CRAN.R-project.org/package=ProbForecastGOP), which implements the geostatistical output perturbation (GOP) method. BMA forecasting models use mixture distributions, in which each component corresponds to an ensemble member, and the form of the component distribution depends on the weather parameter (temperature, quantitative precipitation or wind speed). The model parameters are estimated from training data. The GOP technique uses geostatistical methods to produce probabilistic forecasts of entire weather fields for temperature or pressure, based on a single numerical forecast on a spatial grid. Both packages include functions for evaluating predictive performance, in addition to model fitting and forecasting.
Analyzing an Electronic Limit Order Book
The [*orderbook*](https://CRAN.R-project.org/package=orderbook) package provides facilities for exploring and visualizing the data associated with an order book: the electronic collection of the outstanding limit orders for a financial instrument. This article provides an overview of the [*orderbook*](https://CRAN.R-project.org/package=orderbook) package and examples of its use.
hglm: A Package for Fitting Hierarchical Generalized Linear Models
We present the [*hglm*](https://CRAN.R-project.org/package=hglm) package for fitting hierarchical generalized linear models. It can be used for linear mixed models and generalized linear mixed models with random effects for a variety of links and a variety of distributions for both the outcomes and the random effects. Fixed effects can also be fitted in the dispersion part of the model.
Source References
Since version 2.10.0, R includes expanded support for source references in R code and `.Rd` files. This paper describes the origin and purposes of source references, and current and future support for them.
dclone: Data Cloning in R
The [*dclone*](https://CRAN.R-project.org/package=dclone) R package contains low level functions for implementing maximum likelihood estimating procedures for complex models using data cloning and Bayesian Markov Chain Monte Carlo methods with support for JAGS, WinBUGS and OpenBUGS.
stringr: modern, consistent string processing
String processing is not glamorous, but it is frequently used in data cleaning and preparation. The existing string functions in R are powerful, but not friendly. To remedy this, the [*stringr*](https://CRAN.R-project.org/package=stringr) package provides string functions that are simpler and more consistent, and also fixes some functionality that R is missing compared to other programming languages.
Solving Differential Equations in R
Although R is still predominantly applied for statistical analysis and graphical representation, it is rapidly becoming more suitable for mathematical computing. One of the fields where considerable progress has been made recently is the solution of differential equations. Here we give a brief overview of differential equations that can now be solved by R.[^1]
Bayesian Estimation of the GARCH(1,1) Model with Student-t Innovations
This note presents the R package [*bayesGARCH*](https://CRAN.R-project.org/package=bayesGARCH) which provides functions for the Bayesian estimation of the parsimonious and effective GARCH(1,1) model with Student-$t$ innovations. The estimation procedure is fully automatic and thus avoids the tedious task of tuning an MCMC sampling algorithm. The usage of the package is shown in an empirical application to exchange rate log-returns.
cudaBayesreg: Bayesian Computation in CUDA
Graphical processing units are rapidly gaining maturity as powerful general parallel computing devices. The package [*cudaBayesreg*](https://CRAN.R-project.org/package=cudaBayesreg) uses GPU--oriented procedures to improve the performance of Bayesian computations. The paper motivates the need for devising high-performance computing strategies in the context of fMRI data analysis. Some features of the package for Bayesian analysis of brain fMRI data are illustrated. Comparative computing performance figures between sequential and parallel implementations are presented as well.
binGroup: A Package for Group Testing
When the prevalence of a disease or of some other binary characteristic is small, group testing (also known as pooled testing) is frequently used to estimate the prevalence and/or to identify individuals as positive or negative. We have developed the *binGroup* package as the first package designed to address the estimation problem in group testing. We present functions to estimate an overall prevalence for a homogeneous population. Also, for this setting, we have functions to aid in the very important choice of the group size. When individuals come from a heterogeneous population, our group testing regression functions can be used to estimate an individual probability of disease positivity by using the group observations only. We illustrate our functions with data from a multiple vector transfer design experiment and a human infectious disease prevalence study.
The RecordLinkage Package: Detecting Errors in Data
Record linkage deals with detecting homonyms and mainly synonyms in data. The package [*RecordLinkage*](https://CRAN.R-project.org/package=RecordLinkage) provides means to perform and evaluate different record linkage methods. A stochastic framework is implemented which calculates weights through an EM algorithm. The determination of the necessary thresholds in this model can be achieved by tools of extreme value theory. Furthermore, machine learning methods are utilized, including decision trees ([*rpart*](https://CRAN.R-project.org/package=rpart)), bootstrap aggregating ([*bagging*](https://CRAN.R-project.org/package=bagging)), ada boost ([*ada*](https://CRAN.R-project.org/package=ada)), neural nets ([*nnet*](https://CRAN.R-project.org/package=nnet)) and support vector machines ([*svm*](https://CRAN.R-project.org/package=svm)). The generation of record pairs and comparison patterns from single data items are provided as well. Comparison patterns can be chosen to be binary or based on some string metrics. In order to reduce computation time and memory usage, blocking can be used. Future development will concentrate on additional and refined methods, performance improvements and input/output facilities needed for real-world application.
spikeslab: Prediction and Variable Selection Using Spike and Slab Regression
Weighted generalized ridge regression offers unique advantages in correlated high-dimensional problems. Such estimators can be efficiently computed using Bayesian spike and slab models and are effective for prediction. For sparse variable selection, a generalization of the elastic net can be used in tandem with these Bayesian estimates. In this article, we describe the R-software package *spikeslab* for implementing this new spike and slab prediction and variable selection methodology.
Raster Images in R Graphics
The R graphics engine has new support for rendering raster images via the functions `rasterImage()` and `grid.raster()`. This leads to better scaling of raster images, faster rendering to screen, and smaller graphics files. Several examples of possible applications of these new features are described.
IsoGene: An R Package for Analyzing Dose-response Studies in Microarray Experiments
*IsoGene* is an R package for the analysis of dose-response microarray experiments to identify gene or subsets of genes with a monotone relationship between the gene expression and the doses. Several testing procedures (i.e., the likelihood ratio test, Williams, Marcus, the $M$, and Modified $M$), that take into account the order restriction of the means with respect to the increasing doses are implemented in the package. The inference is based on resampling methods, both permutations and the Significance Analysis of Microarrays (SAM).
Online Reproducible Research: An Application to Multivariate Analysis of Bacterial DNA Fingerprint Data
This paper presents an example of online reproducible multivariate data analysis. This example is based on a web page providing an online computing facility on a server. HTML forms contain editable R code snippets that can be executed in any web browser thanks to the Rweb software. The example is based on the multivariate analysis of DNA fingerprints of the internal bacterial flora of the poultry red mite *Dermanyssus gallinae*. Several multivariate data analysis methods from the [*ade4*](https://CRAN.R-project.org/package=ade4) package are used to compare the fingerprints of mite pools coming from various poultry farms. All the computations and graphical displays can be redone interactively and further explored online, using only a web browser. Statistical methods are detailed in the duality diagram framework, and a discussion about online reproducibility is initiated.
MCMC for Generalized Linear Mixed Models with glmmBUGS
The *glmmBUGS* package is a bridging tool between Generalized Linear Mixed Models (GLMMs) in R and the BUGS language. It provides a simple way of performing Bayesian inference using Markov Chain Monte Carlo (MCMC) methods, taking a model formula and data frame in R and writing a BUGS model file, data file, and initial values files. Functions are provided to reformat and summarize the BUGS results. A key aim of the package is to provide files and objects that can be modified prior to calling BUGS, giving users a platform for customizing and extending the models to accommodate a wide variety of analyses.
Mapping and Measuring Country Shapes
The article introduces the [*cshapes*](https://CRAN.R-project.org/package=cshapes) R package, which includes our CShapes dataset of contemporary and historical country boundaries, as well as computational tools for computing geographical measures from these maps. We provide an overview of the need for considering spatial dependence in comparative research, how this requires appropriate historical maps, and detail how the [*cshapes*](https://CRAN.R-project.org/package=cshapes) associated R package [*cshapes*](https://CRAN.R-project.org/package=cshapes) can contribute to these ends. We illustrate the use of the package for drawing maps, computing spatial variables for countries, and generating weights matrices for spatial statistics.
tmvtnorm: A Package for the Truncated Multivariate Normal Distribution
In this article we present [*tmvtnorm*](https://CRAN.R-project.org/package=tmvtnorm), an R package implementation for the truncated multivariate normal distribution. We consider random number generation with rejection and Gibbs sampling, computation of marginal densities as well as computation of the mean and covariance of the truncated variables. This contribution brings together latest research in this field and provides useful methods for both scholars and practitioners when working with truncated normal variables.
neuralnet: Training of Neural Networks
Artificial neural networks are applied in many situations. [*neuralnet*](https://CRAN.R-project.org/package=neuralnet) is built to train multi-layer perceptrons in the context of regression analyses, i.e. to approximate functional relationships between covariates and response variables. Thus, neural networks are used as extensions of generalized linear models.\ [*neuralnet*](https://CRAN.R-project.org/package=neuralnet) is a very flexible package. The backpropagation algorithm and three versions of resilient backpropagation are implemented and it provides a custom-choice of activation and error function. An arbitrary number of covariates and response variables as well as of hidden layers can theoretically be included.\ The paper gives a brief introduction to multi-layer perceptrons and resilient backpropagation and demonstrates the application of [*neuralnet*](https://CRAN.R-project.org/package=neuralnet) using the data set `infert`, which is contained in the R distribution.
glmperm: A Permutation of Regressor Residuals Test for Inference in Generalized Linear Models
We introduce a new R package called [*glmperm*](https://CRAN.R-project.org/package=glmperm) for inference in generalized linear models especially for small and moderate-sized data sets. The inference is based on the permutation of regressor residuals test introduced by @Potter05. The implementation of [*glmperm*](https://CRAN.R-project.org/package=glmperm) outperforms currently available permutation test software as [*glmperm*](https://CRAN.R-project.org/package=glmperm) can be applied in situations where more than one covariate is involved.
Two-sided Exact Tests and Matching Confidence Intervals for Discrete Data
There is an inherent relationship between two-sided hypothesis tests and confidence intervals. A series of two-sided hypothesis tests may be inverted to obtain the 100(1-$\alpha$)% confidence interval defined as the smallest interval that contains all point null parameter values that would not be rejected at the $\alpha$ level. Unfortunately, for discrete data there are several different ways of defining two-sided exact tests and the most commonly used two-sided exact tests are defined one way, while the most commonly used exact confidence intervals are inversions of tests defined another way. This can lead to inconsistencies where the exact test rejects but the exact confidence interval contains the null parameter value. The packages [*exactci*](https://CRAN.R-project.org/package=exactci) and [*exact2x2*](https://CRAN.R-project.org/package=exact2x2) provide several exact tests with the matching confidence intervals avoiding these inconsistencies as much as possible. Examples are given for binomial and Poisson parameters and both paired and unpaired $2 \times 2$ tables.
ConvergenceConcepts: An R Package to Investigate Various Modes of Convergence
[*ConvergenceConcepts*](https://CRAN.R-project.org/package=ConvergenceConcepts) is an R package, built upon the [*tkrplot*](https://CRAN.R-project.org/package=tkrplot), [*tcltk*](https://CRAN.R-project.org/package=tcltk) and [*lattice*](https://CRAN.R-project.org/package=lattice) packages, designed to investigate the convergence of simulated sequences of random variables. Four classical modes of convergence may be studied, namely: almost sure convergence (*a.s.*), convergence in probability (*P*), convergence in law (*L*) and convergence in $r$-th mean (*r*). This investigation is performed through accurate graphical representations. This package may be used as a pedagogical tool. It may give students a better understanding of these notions and help them to visualize these difficult theoretical concepts. Moreover, some scholars could gain some insight into the behaviour of some random sequences they are interested in.
copas: An R package for Fitting the Copas Selection Model
This article describes the R package [*copas*](https://CRAN.R-project.org/package=copas) which is an add-on package to the R package [*meta*](https://CRAN.R-project.org/package=meta). The R package [*copas*](https://CRAN.R-project.org/package=copas) can be used to fit the Copas selection model to adjust for bias in meta-analysis. A clinical example is used to illustrate fitting and interpreting the Copas selection model.
Party on!
Random forests are one of the most popular statistical learning algorithms, and a variety of methods for fitting random forests and related recursive partitioning approaches is available in R. This paper points out two important features of the random forest implementation `cforest` available in the *party* package: The resulting forests are unbiased and thus preferable to the `randomForest` implementation available in *randomForest* if predictor variables are of different types. Moreover, a conditional permutation importance measure has recently been added to the *party* package, which can help evaluate the importance of correlated predictor variables. The rationale of this new measure is illustrated and hands-on advice is given for the usage of recursive partitioning tools in R.
Aspects of the Social Organization and Trajectory of the R Project
Based partly on interviews with members of the R Core team, this paper considers the development of the R Project in the context of open-source software development and, more generally, voluntary activities. The paper describes aspects of the social organization of the R Project, including the organization of the R Core team; describes the trajectory of the R Project; seeks to identify factors crucial to the success of R; and speculates about the prospects for R.
asympTest: A Simple R Package for Classical Parametric Statistical Tests and Confidence Intervals in Large Samples
[*asympTest*](https://CRAN.R-project.org/package=asympTest) is an R package implementing large sample tests and confidence intervals. One and two sample mean and variance tests (differences and ratios) are considered. The test statistics are all expressed in the same form as the Student t-test, which facilitates their presentation in the classroom. This contribution also fills the gap of a robust (to non-normality) alternative to the chi-square single variance test for large samples, since no such procedure is implemented in standard statistical software.
Rattle: A Data Mining GUI for R
Data mining delivers insights, patterns, and descriptive and predictive models from the large amounts of data available today in many organisations. The data miner draws heavily on methodologies, techniques and algorithms from statistics, machine learning, and computer science. R increasingly provides a powerful platform for data mining. However, scripting and programming is sometimes a challenge for data analysts moving into data mining. The Rattle package provides a graphical user interface specifically for data mining using R. It also provides a stepping stone toward using R as a programming language for data analysis.
sos: Searching Help Pages of R Packages
The [*sos*](https://CRAN.R-project.org/package=sos) package provides a means to quickly and flexibly search the help pages of contributed packages, finding functions and datasets in seconds or minutes that could not be found in hours or days by any other means we know. Its `findFn` function accesses Jonathan Baron's *R Site Search* database and returns the matches in a data frame of class `"findFn"`, which can be further manipulated by other [*sos*](https://CRAN.R-project.org/package=sos) functions to produce, for example, an Excel file that starts with a summary sheet that makes it relatively easy to prioritize alternative packages for further study. As such, it provides a very powerful way to do a literature search for functions and packages relevant to a particular topic of interest and could become virtually mandatory for authors of new packages or papers in publications such as *The R Journal* and the *Journal of Statistical Software*.
Transitioning to R: Replicating SAS, Stata, and SUDAAN Analysis Techniques in Health Policy Data
Statistical, data manipulation, and presentation tools make R an ideal integrated package for research in the fields of health policy and healthcare management and evaluation. However, the technical documentation accompanying most data sets used by researchers in these fields does not include syntax examples for analysts to make the transition from another statistical package to R. This paper describes the steps required to import health policy data into R, to prepare that data for analysis using the two most common complex survey variance calculation techniques, and to produce the principal set of statistical estimates sought by health policy researchers. Using data from the Medical Expenditure Panel Survey Household Component (MEPS-HC), this paper outlines complex survey data analysis techniques in R, with side-by-side comparisons to the SAS, Stata, and SUDAAN statistical software packages.
New Numerical Algorithm for Multivariate Normal Probabilities in Package mvtnorm
The 'New Numerical Algorithm for Multivariate Normal Probabilities in Package [*mvtnorm*](https://CRAN.R-project.org/package=mvtnorm)' article from the 2009-1 issue.
EMD: A Package for Empirical Mode Decomposition and Hilbert Spectrum
The 'EMD: A Package for Empirical Mode Decomposition and Hilbert Spectrum' article from the 2009-1 issue.
AdMit
A package for constructing and using an adaptive mixture of Student-t distributions as a flexible candidate distribution for efficient simulation.
Easier parallel computing in R with snowfall and sfCluster
The 'Easier parallel computing in R with snowfall and sfCluster' article from the 2009-1 issue.
expert: Modeling Without Data Using Expert Opinion
The [*expert*](https://CRAN.R-project.org/package=expert): Modeling Without Data Using Expert Opinion' article from the 2009-1 issue.
Drawing Diagrams with R
The 'Drawing Diagrams with R' article from the 2009-1 issue.
Collaborative Software Development Using R-Forge
The 'Collaborative Software Development Using R-Forge' article from the 2009-1 issue.
Facets of R
The 'Facets of R' article from the 2009-1 issue.
The hwriter package : Composing HTML documents with R objects
The 'The hwriter package : Composing HTML documents with R objects' article from the 2009-1 issue.
PMML: An Open Standard for Sharing Models
The 'PMML: An Open Standard for Sharing Models' article from the 2009-1 issue.
Sample Size Estimation while Controlling False Discovery Rate for Microarray Experiments Using the ssize.fdr Package
Microarray experiments are becoming more and more popular and critical in many biological disciplines. As in any statistical experiment, appropriate experimental design is essential for reliable statistical inference, and sample size has a crucial role in experimental design. Because microarray experiments are rather costly, it is important to have an adequate sample size that will achieve a desired power without wasting resources.
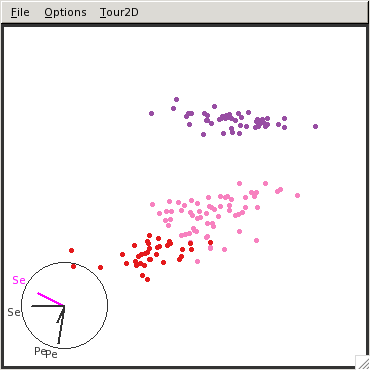
An introduction to rggobi
"An introduction to rggobi" published in R News.
Introducing the bipartite package: Analysing ecological networks
"Introducing the bipartite package: Analysing ecological networks" published in R News.
The profileModel R package: Profiling objectives for models with linear predictors
"The profileModel R package: Profiling objectives for models with linear predictors" published in R News.
An introduction to text mining in R
"An introduction to text mining in R" published in R News.
Animation: A package for statistical animations
"Animation: A package for statistical animations" published in R News.
The VGAM package
"The VGAM package" published in R News.
Comparing non-identical objects
"Comparing non-identical objects" published in R News.
Mvna: An R package for the Nelson-Aalen estimator in multistate models
"Mvna: An R package for the Nelson-Aalen estimator in multistate models" published in R News.
Programmers’ Niche: The Y of R
"Programmers’ Niche: The Y of R" published in R News.
Using Sweave with LyX
"Using Sweave with LyX" published in R News.
Trade costs
"Trade costs" published in R News.
Survival analysis for cohorts with missing covariate information
"Survival analysis for cohorts with missing covariate information" published in R News.
Segmented: An R package to fit regression models with broken-line relationships
"Segmented: An R package to fit regression models with broken-line relationships" published in R News.
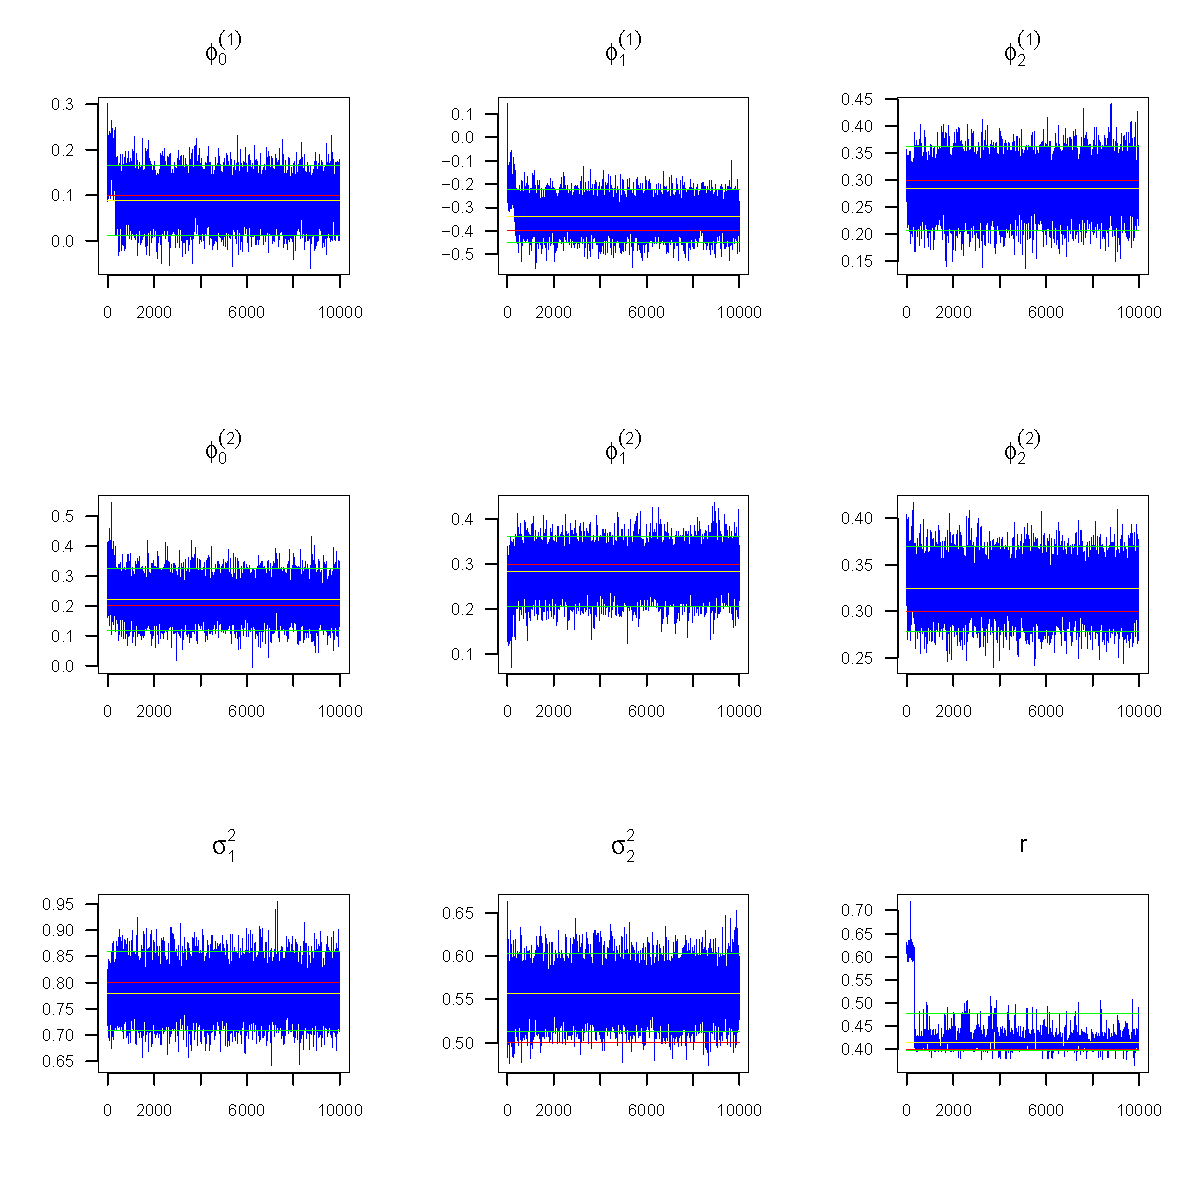
Bayesian estimation for parsimonious threshold autoregressive models in R
"Bayesian estimation for parsimonious threshold autoregressive models in R" published in R News.
Statistical modeling of loss distributions using actuar
"Statistical modeling of loss distributions using actuar" published in R News.
Programmers’ Niche: Multivariate polynomials in r
"Programmers’ Niche: Multivariate polynomials in r" published in R News.
R Help Desk: How can I avoid this loop or make it faster?
"R Help Desk: How can I avoid this loop or make it faster?" published in R News.

SpherWave: An R package for analyzing scattered spherical data by spherical wavelets
"SpherWave: An R package for analyzing scattered spherical data by spherical wavelets" published in R News.

Diving behaviour analysis in R
"Diving behaviour analysis in R" published in R News.
Very large numbers in R: Introducing package Brobdingnag
"Very large numbers in R: Introducing package Brobdingnag" published in R News.
Applied bayesian non- and semi-parametric inference using DPpackage
"Applied bayesian non- and semi-parametric inference using DPpackage" published in R News.

An introduction to gWidgets
"An introduction to gWidgets" published in R News.
Financial journalism with R
"Financial journalism with R" published in R News.
Need a hint?
"Need a hint?" published in R News.
Psychometrics task view
"Psychometrics task view" published in R News.
Meta: An R package for meta-analysis
"Meta: An R package for meta-analysis" published in R News.
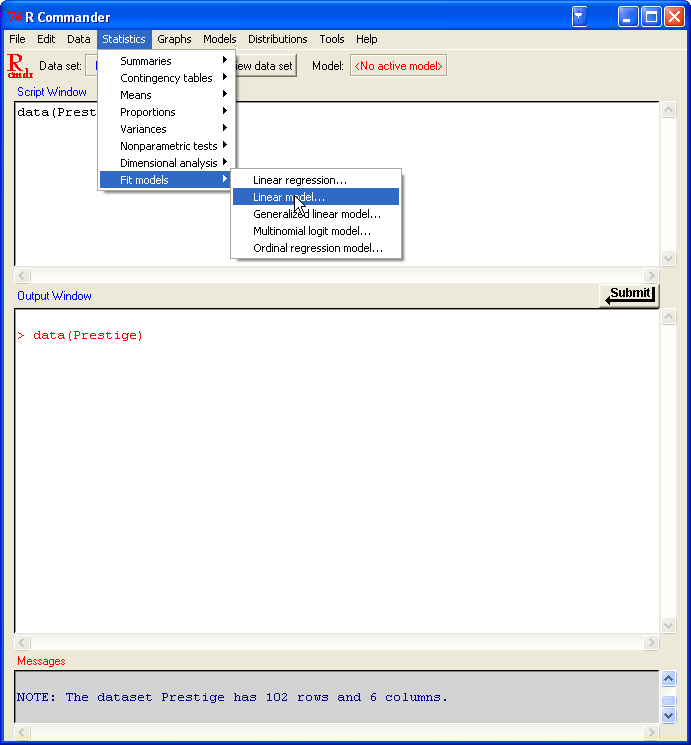
Extending the R Commander by “plug-in” packages
"Extending the R Commander by “plug-in” packages" published in R News.
Improvements to the multiple testing package multtest
"Improvements to the multiple testing package multtest" published in R News.
New functions for multivariate analysis
"New functions for multivariate analysis" published in R News.
Gnm: A package for generalized nonlinear models
"Gnm: A package for generalized nonlinear models" published in R News.

Fmri: A package for analyzing fmri data
"Fmri: A package for analyzing fmri data" published in R News.
Optmatch: Flexible, optimal matching for observational studies
"Optmatch: Flexible, optimal matching for observational studies" published in R News.
Random survival forests for R
"Random survival forests for R" published in R News.
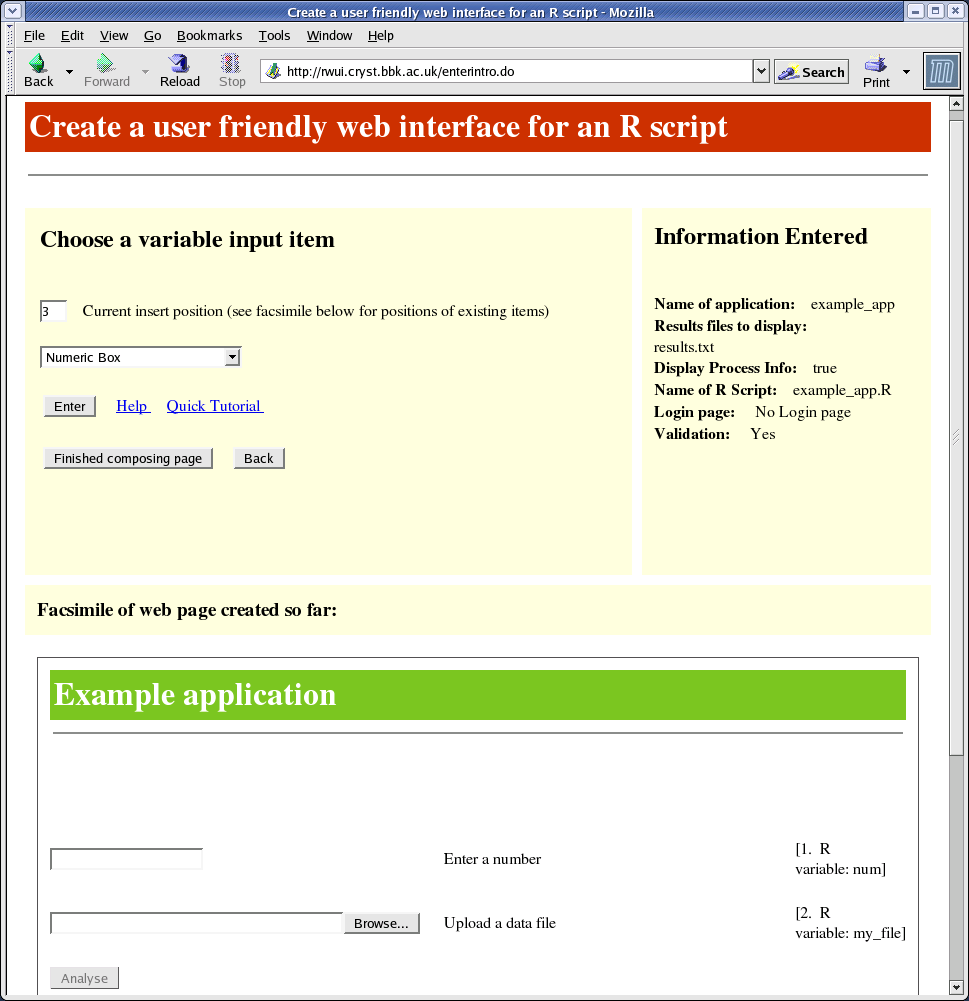
Rwui: A web application to create user friendly web interfaces for R scripts
"Rwui: A web application to create user friendly web interfaces for R scripts" published in R News.
The np package: Kernel methods for categorical and continuous data
"The np package: Kernel methods for categorical and continuous data" published in R News.
eiPack: {R} \times {C} ecological inferences and higher-dimension data management
"eiPack: {R} \times {C} ecological inferences and higher-dimension data management" published in R News.
The ade4 package–II: Two-table and {K}-table methods
"The ade4 package–II: Two-table and {K}-table methods" published in R News.
Review of “The R Book”
"Review of “The R Book”" published in R News.
Viewing binary files with the hexView package
"Viewing binary files with the hexView package" published in R News.
FlexMix: An R package for finite mixture modelling
"FlexMix: An R package for finite mixture modelling" published in R News.
Using R to perform the AMMI analysis on agriculture variety trials
"Using R to perform the AMMI analysis on agriculture variety trials" published in R News.
Inferences for ratios of normal means
"Inferences for ratios of normal means" published in R News.
Working with unknown values
"Working with unknown values" published in R News.
A new package for fitting random effect models
"A new package for fitting random effect models" published in R News.
Augmenting R with Unix tools
"Augmenting R with Unix tools" published in R News.
POT: Modelling peaks over a threshold
"POT: Modelling peaks over a threshold" published in R News.
Backtests
"Backtests" published in R News.
Review of John Verzani’s book: Using R for Introductory Statistics
"Review of John Verzani’s book: Using R for Introductory Statistics" published in R News.
Graphs and networks: Tools in Bioconductor
"Graphs and networks: Tools in Bioconductor" published in R News.
Modeling package dependencies using graphs
"Modeling package dependencies using graphs" published in R News.
Image analysis for microscopy screens
"Image analysis for microscopy screens" published in R News.
Beadarray: An R package to analyse Illumina BeadArrays
"Beadarray: An R package to analyse Illumina BeadArrays" published in R News.
Transcript mapping with high-density tiling arrays
"Transcript mapping with high-density tiling arrays" published in R News.
Analyzing flow cytometry data with Bioconductor
"Analyzing flow cytometry data with Bioconductor" published in R News.
Protein complex membership estimation using apComplex
"Protein complex membership estimation using apComplex" published in R News.
SNP metadata access and use with Bioconductor
"SNP metadata access and use with Bioconductor" published in R News.
Integrating biological data resources into R with biomaRt
"Integrating biological data resources into R with biomaRt" published in R News.
Identifying interesting genes with siggenes
"Identifying interesting genes with siggenes" published in R News.
Reverse engineering genetic networks using the GeneNet package
"Reverse engineering genetic networks using the GeneNet package" published in R News.
A multivariate approach to integrating datasets using made4 and ade4
"A multivariate approach to integrating datasets using made4 and ade4" published in R News.
Using amap and ctc packages for huge clustering
"Using amap and ctc packages for huge clustering" published in R News.
Model-based microarray image analysis
"Model-based microarray image analysis" published in R News.
Sample size estimation for microarray experiments using the ssize package
"Sample size estimation for microarray experiments using the ssize package" published in R News.
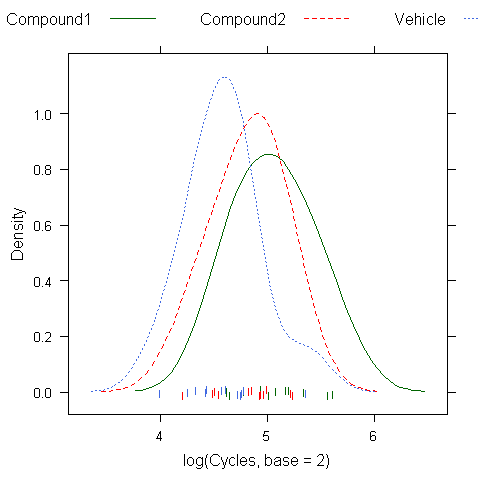
Sweave and the open document format – the odfWeave package
"Sweave and the open document format – the odfWeave package" published in R News.
Plotrix
"Plotrix" published in R News.

Rpanel: Making graphs move with tcltk
"Rpanel: Making graphs move with tcltk" published in R News.
R’s role in the climate change debate.
"R’s role in the climate change debate." published in R News.
Interacting with data using the filehash package
"Interacting with data using the filehash package" published in R News.
Special functions in R: Introducing the gsl package
"Special functions in R: Introducing the gsl package" published in R News.
A short introduction to the SIMEX and MCSIMEX
"A short introduction to the SIMEX and MCSIMEX" published in R News.
Parametric links for binary response
"Parametric links for binary response" published in R News.
A new package for the Birnbaum-Saunders distribution
"A new package for the Birnbaum-Saunders distribution" published in R News.
Review of Fionn Murtagh’s book: correspondence analysis and data coding with Java and R
"Review of Fionn Murtagh’s book: correspondence analysis and data coding with Java and R" published in R News.
R Help Desk: Accessing the sources
"R Help Desk: Accessing the sources" published in R News.

Fitting dose-response curves from bioassays and toxicity testing
"Fitting dose-response curves from bioassays and toxicity testing" published in R News.
Non-linear regression for optimising the separation of carboxylic acids
"Non-linear regression for optimising the separation of carboxylic acids" published in R News.
The pls package
"The pls package" published in R News.
Some applications of model-based clustering in chemistry
"Some applications of model-based clustering in chemistry" published in R News.
Mapping databases of X-ray powder patterns
"Mapping databases of X-ray powder patterns" published in R News.
Generating, using and visualizing molecular information in R
"Generating, using and visualizing molecular information in R" published in R News.
S4 classes for distributions
"S4 classes for distributions" published in R News.
The regress function
"The regress function" published in R News.
Processing data for outliers
"Processing data for outliers" published in R News.
Analysing equity portfolios in R
"Analysing equity portfolios in R" published in R News.
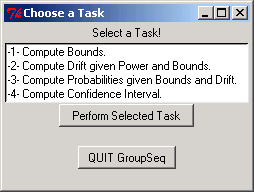
GroupSeq: Designing clinical trials using group sequential designs
"GroupSeq: Designing clinical trials using group sequential designs" published in R News.
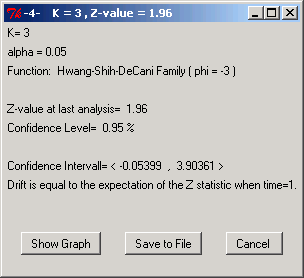
Using R/Sweave in everyday clinical practice
"Using R/Sweave in everyday clinical practice" published in R News.
changeLOS: An R-package for change in length of hospital stay based on the Aalen-Johansen estimator
"changeLOS: An R-package for change in length of hospital stay based on the Aalen-Johansen estimator" published in R News.
Balloon plot
"Balloon plot" published in R News.
Drawing pedigree diagrams with R and graphviz
"Drawing pedigree diagrams with R and graphviz" published in R News.

Non-standard fonts in PostScript and PDF graphics
"Non-standard fonts in PostScript and PDF graphics" published in R News.
The doBy package
"The doBy package" published in R News.
Normed division algebras with R: Introducing the onion package
"Normed division algebras with R: Introducing the onion package" published in R News.
Electrical properties of resistor networks
"Electrical properties of resistor networks" published in R News.
Applied Bayesian inference in R using MCMCpack
"Applied Bayesian inference in R using MCMCpack" published in R News.
CODA: Convergence diagnosis and output analysis for MCMC
"CODA: Convergence diagnosis and output analysis for MCMC" published in R News.
Bayesian software validation
"Bayesian software validation" published in R News.
Making BUGS open
"Making BUGS open" published in R News.
The BUGS language
"The BUGS language" published in R News.
Bayesian data analysis using R
"Bayesian data analysis using R" published in R News.
BMA: An R package for Bayesian model averaging
"BMA: An R package for Bayesian model averaging" published in R News.
Classes and methods for spatial data in R
"Classes and methods for spatial data in R" published in R News.
Running long R jobs with Condor DAG
"Running long R jobs with Condor DAG" published in R News.
Rstream: Streams of random numbers for stochastic simulation
"Rstream: Streams of random numbers for stochastic simulation" published in R News.
Mfp: Multivariable fractional polynomials
"Mfp: Multivariable fractional polynomials" published in R News.
Crossdes: A package for design and randomization in crossover studies
"Crossdes: A package for design and randomization in crossover studies" published in R News.
R Help Desk: Make “R CMD” work under Windows – an example
"R Help Desk: Make “R CMD” work under Windows – an example" published in R News.
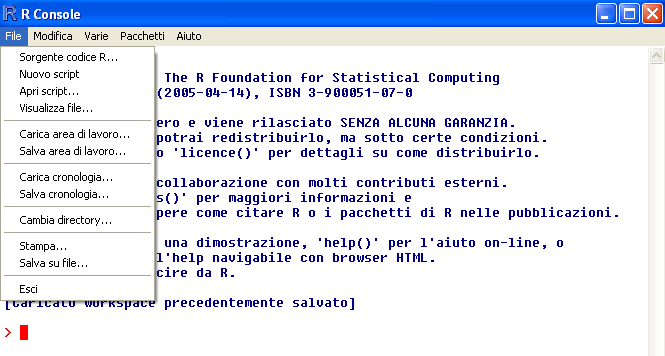
Internationalization features of R 2.1.0
"Internationalization features of R 2.1.0" published in R News.

Packages and their management in R 2.1.0
"Packages and their management in R 2.1.0" published in R News.
Recent changes in grid graphics
"Recent changes in grid graphics" published in R News.
Hoa: An R package bundle for higher order likelihood inference
"Hoa: An R package bundle for higher order likelihood inference" published in R News.
Fitting linear mixed models in R
"Fitting linear mixed models in R" published in R News.
Using R for statistical seismology
"Using R for statistical seismology" published in R News.
Literate programming for creating and maintaining packages
"Literate programming for creating and maintaining packages" published in R News.
CRAN task views
"CRAN task views" published in R News.
Using control structures with Sweave
"Using control structures with Sweave" published in R News.
The value of R for preclinical statisticians
"The value of R for preclinical statisticians" published in R News.
Recreational mathematics with R: Introducing the “magic” package
"Recreational mathematics with R: Introducing the “magic” package" published in R News.
Programmer’s Niche: How do you spell that number?
"Programmer’s Niche: How do you spell that number?" published in R News.
Lazy loading and packages in R 2.0.0
"Lazy loading and packages in R 2.0.0" published in R News.
Fonts, lines, and transparency in R graphics
"Fonts, lines, and transparency in R graphics" published in R News.
The NMMAPSdata package
"The NMMAPSdata package" published in R News.
Laying out pathways with Rgraphviz
"Laying out pathways with Rgraphviz" published in R News.
Fusing R and BUGS through Wine
"Fusing R and BUGS through Wine" published in R News.
R package maintenance
"R package maintenance" published in R News.
The decision to use R
"The decision to use R" published in R News.
The ade4 package — I: One-table methods
"The ade4 package — I: One-table methods" published in R News.
Qcc: An R package for quality control charting and statistical process control
"Qcc: An R package for quality control charting and statistical process control" published in R News.
Least squares calculations in R
"Least squares calculations in R" published in R News.
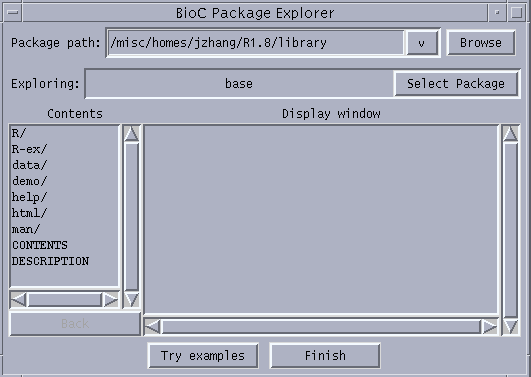
Tools for interactively exploring R packages
"Tools for interactively exploring R packages" published in R News.
The survival package
"The survival package" published in R News.
R Help Desk: Date and time classes in R
"R Help Desk: Date and time classes in R" published in R News.
Programmers’ Niche: A simple class, in S3 and S4
"Programmers’ Niche: A simple class, in S3 and S4" published in R News.
Dimensional reduction for data mapping
"Dimensional reduction for data mapping" published in R News.

R as a simulation platform in ecological modelling
"R as a simulation platform in ecological modelling" published in R News.
Using R for estimating longitudinal student achievement models
"Using R for estimating longitudinal student achievement models" published in R News.
lmeSplines
"lmeSplines" published in R News.
Debugging without (too many) tears
"Debugging without (too many) tears" published in R News.
The R2HTML package
"The R2HTML package" published in R News.
R Help Desk: Package management
"R Help Desk: Package management" published in R News.
R Help Desk: An introduction to using R’s base graphics
"R Help Desk: An introduction to using R’s base graphics" published in R News.
Integrating grid graphics output with base graphics output
"Integrating grid graphics output with base graphics output" published in R News.
A new package for the general error distribution
"A new package for the general error distribution" published in R News.
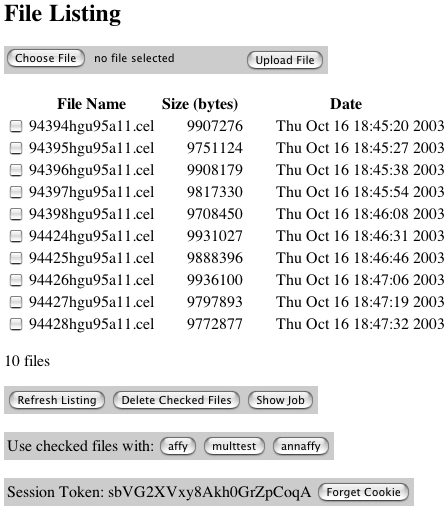
Web-based microarray analysis using Bioconductor
"Web-based microarray analysis using Bioconductor" published in R News.
Sweave, part II: Package vignettes
"Sweave, part II: Package vignettes" published in R News.
Name space management for R
"Name space management for R" published in R News.
Converting packages to S4
"Converting packages to S4" published in R News.
The genetics package
"The genetics package" published in R News.
Variance inflation factors
"Variance inflation factors" published in R News.
Building Microsoft Windows versions of R and R packages under Intel Linux
"Building Microsoft Windows versions of R and R packages under Intel Linux" published in R News.
Analysing survey data in R
"Analysing survey data in R" published in R News.
Computational gains using RPVM on a Beowulf cluster
"Computational gains using RPVM on a Beowulf cluster" published in R News.
R Help Desk: Getting help – R’s help facilities and manuals
"R Help Desk: Getting help – R’s help facilities and manuals" published in R News.

Resampling methods in R: The boot package
"Resampling methods in R: The boot package" published in R News.
Diagnostic checking in regression relationships
"Diagnostic checking in regression relationships" published in R News.
Delayed data packages
"Delayed data packages" published in R News.
Geepack: Yet another package for generalized estimating equations
"Geepack: Yet another package for generalized estimating equations" published in R News.
On multiple comparisons in R
"On multiple comparisons in R" published in R News.
Classification and regression by randomForest
"Classification and regression by randomForest" published in R News.
Some strategies for dealing with genomic data
"Some strategies for dealing with genomic data" published in R News.
Changes to the R-Tcl/Tk package
"Changes to the R-Tcl/Tk package" published in R News.

Sweave, part I: Mixing R and LaTeX
"Sweave, part I: Mixing R and LaTeX" published in R News.
R Help Desk: Automation of mathematical annotation in plots
"R Help Desk: Automation of mathematical annotation in plots" published in R News.
Time series in R 1.5.0
"Time series in R 1.5.0" published in R News.
Naive time series forecasting methods
"Naive time series forecasting methods" published in R News.
Rmpi: Parallel statistical computing in R
"Rmpi: Parallel statistical computing in R" published in R News.
The grid graphics package
"The grid graphics package" published in R News.
Lattice
"Lattice" published in R News.
Programmer’s Niche
"Programmer’s Niche" published in R News.
geoRglm: A package for generalised linear spatial models
"geoRglm: A package for generalised linear spatial models" published in R News.
Querying PubMed
"Querying PubMed" published in R News.
Evd: Extreme value distributions
"Evd: Extreme value distributions" published in R News.
Ipred: Improved predictors
"Ipred: Improved predictors" published in R News.
Reading foreign files
"Reading foreign files" published in R News.
Maximally selected rank statistics in R
"Maximally selected rank statistics in R" published in R News.
Quality control and early diagnostics for cDNA microarrays
"Quality control and early diagnostics for cDNA microarrays" published in R News.
Bioconductor
"Bioconductor" published in R News.
AnalyzeFMRI: An R package for the exploration and analysis of MRI and fMRI datasets
"AnalyzeFMRI: An R package for the exploration and analysis of MRI and fMRI datasets" published in R News.

Using R for the analysis of DNA microarray data
"Using R for the analysis of DNA microarray data" published in R News.
Porting R to Darwin/X11 and Mac OS X
"Porting R to Darwin/X11 and Mac OS X" published in R News.
RPVM: Cluster statistical computing in R
"RPVM: Cluster statistical computing in R" published in R News.
Strucchange: Testing for structural change in linear regression relationships
"Strucchange: Testing for structural change in linear regression relationships" published in R News.
Programmer’s Niche: Macros in R
"Programmer’s Niche: Macros in R" published in R News.
More on spatial data
"More on spatial data" published in R News.
Object-oriented programming in R
"Object-oriented programming in R" published in R News.
In search of C/C++ & FORTRAN routines
"In search of C/C++ & FORTRAN routines" published in R News.
Support vector machines
"Support vector machines" published in R News.

A primer on the R-Tcl/Tk package
"A primer on the R-Tcl/Tk package" published in R News.
Wle: A package for robust statistics using weighted likelihood
"Wle: A package for robust statistics using weighted likelihood" published in R News.
Date-time classes
"Date-time classes" published in R News.
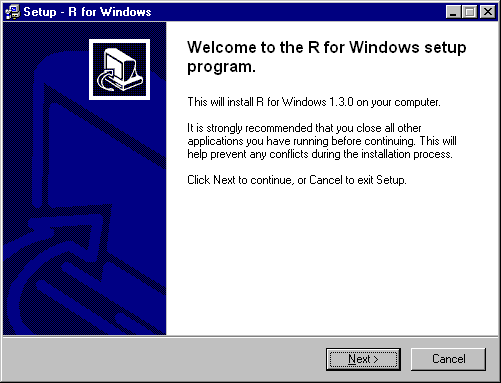
Installing R under Windows
"Installing R under Windows" published in R News.
geoR: A package for geostatistical analysis
"geoR: A package for geostatistical analysis" published in R News.
Simulation and analysis of random fields
"Simulation and analysis of random fields" published in R News.
Mgcv: GAMs and generalized ridge regression for R
"Mgcv: GAMs and generalized ridge regression for R" published in R News.
What’s the point of “tensor”?
"What’s the point of “tensor”?" published in R News.
On multivariate t and Gauß probabilities in R
"On multivariate t and Gauß probabilities in R" published in R News.
Under new memory management
"Under new memory management" published in R News.
On exact rank tests in R
"On exact rank tests in R" published in R News.
Porting R to the Macintosh
"Porting R to the Macintosh" published in R News.
The density of the non-central chi-squared distribution for large values of the noncentrality parameter
"The density of the non-central chi-squared distribution for large values of the noncentrality parameter" published in R News.
Connections
"Connections" published in R News.
Using databases with R
"Using databases with R" published in R News.
Rcgi 4: Making web statistics even easier
"Rcgi 4: Making web statistics even easier" published in R News.
Omegahat packages for R
"Omegahat packages for R" published in R News.
Using XML for statistics: The XML package
"Using XML for statistics: The XML package" published in R News.
Programmer’s Niche
"Programmer’s Niche" published in R News.